Here’s What May Fuel Recovery Believers
Hello Everyone!
My name is Chris Curran, and I’ve been trading in
various capacities for the past 15 years, with the past 5+ years being in a full
time capacity. In October 2001, I switched to mainly trading the S&P 500 E-mini
contract (ES) and have never looked back. The evolution of that market has been
a thing of sheer beauty. With this column, I intend to focus on the stock index
futures market and go over different strategies for trading as well as for when
NOT to trade. My goal overall is to help you put together the little pieces so
that you can see the “big picture.”
On Tuesday, and the
first day of the new quarter, I turned on one of the news channels to
find two pundits talking about the threat of inflation to the U.S. economy.
Ninety minutes later, the ISM Index report was released, showing a number of
49.8 vs. the consensus of 51.0, and also indicating that the manufacturing
sector had contracted for the 4th month in a row. So much for that threat of
inflation!
After the report release, the September S&P 500
contract (SPU) experienced “fast market” conditions as a large computerized sell
program hit the market. Merrill Lynch and First Chicago Corp. were also both big
sellers on the news from 967 to just above the session lows at 960.25. The
market started a slow grind back, putting in a higher low and higher high before
rolling back over. A lunchtime news release that a federal judge had dismissed
a class-action lawsuit against Merrill Lynch regarding analyst research ignited
buying in the Banking and Broker sectors. The news caught some locals with
their pants down and sparked a round of short-covering that snowballed upon
itself. A large Merrill Lynch buyer officially closed the opening gap, and
along with good buying from Goldman Sachs up through 974, forced more local
short-covering.
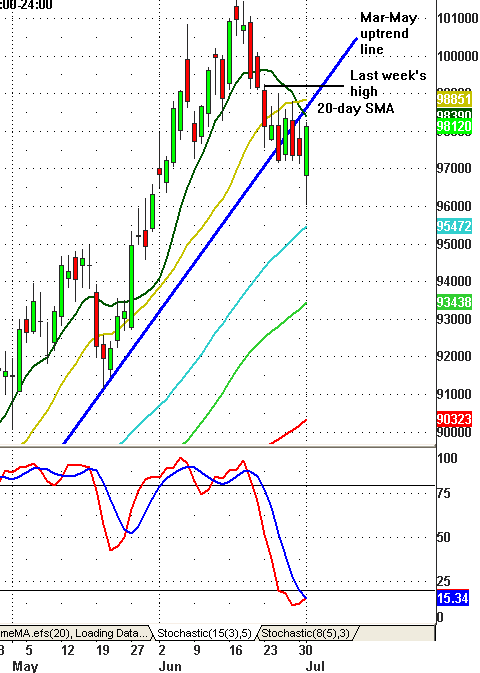
The September futures contract ended the session
+7.90 and closed just off the highs for the day. The high-range close points to
a firm opening, but I’d be very cautious of a “gap and trap” based on the weak
closing premium. The contract is still sitting under its broken daily March-May
uptrend line and faces more stiff resistance at its 20-day SMA at 988.50 up
through last week’s high at 992.50.
With no economic reports scheduled for Wednesday,
expect a contraction of Tuesday’s range ahead of the Unemployment and Payrolls
reports on Thursday. If bonds are any indication, the report may give fuel to
recovery believers.
Daily Pivots for 7-2-03
| Symbol | High | Low | Close | Pivot | R1 | R2 | R3 | S1 | S2 | S3 |
| COMP | 1641.77 | 1598.92 | 1640.06 | 1626.92 | 1654.91 | 1669.77 | 1697.76 | 1612.06 | 1584.07 | 1569.21 |
| INDU | 9050.82 | 8871.2 | 9040.95 | 8987.66 | 9104.11 | 9167.28 | 9283.73 | 8924.49 | 8808.04 | 8744.87 |
| NDX | 1219.23 | 1180.11 | 1217.26 | 1205.53 | 1230.96 | 1244.65 | 1270.08 | 1191.84 | 1166.41 | 1152.72 |
| SPX | 983.26 | 962.1 | 982.31 | 975.89 | 989.68 | 997.05 | 1010.84 | 968.52 | 954.73 | 947.36 |
| ESU | 982.50 | 960.25 | 981.25 | 974.67 | 989.08 | 996.92 | 1011.33 | 966.83 | 952.42 | 944.58 |
| SPU | 982.30 | 960.50 | 981.20 | 974.67 | 988.83 | 996.47 | 1010.63 | 967.03 | 952.87 | 945.23 |
| NDU | 1224.00 | 1180.00 | 1223.00 | 1209.00 | 1238.00 | 1253.00 | 1282.00 | 1194.00 | 1165.00 | 1150.00 |
| NQU | 1223.50 | 1179.00 | 1223.00 | 1208.50 | 1238.00 | 1253.00 | 1282.50 | 1193.50 | 1164.00 | 1149.00 |
| BKX | 869.09 | 847.92 | 868.55 | 861.85 | 875.79 | 883.02 | 896.96 | 854.62 | 840.68 | 833.45 |
| SOX | 366.70 | 351.17 | 365.99 | 361.29 | 371.40 | 376.82 | 386.93 | 355.87 | 345.76 | 340.34 |
| QQQ | 30.38 | 29.26 | 30.35 | 30.00 | 30.73 | 31.12 | 31.85 | 29.61 | 28.88 | 28.49 |
| SPY | 98.85 | 96.43 | 98.53 | 97.94 | 99.44 | 100.36 | 101.86 | 97.02 | 95.52 | 94.60 |
Feel free to
e-mail me with your comments and
questions.
Good luck with your trading on Wednesday and have
a great holiday weekend!
Chris Curran