Here’s What Overrules Momentum Indicators
Continuing our themes of
yesterday’s column, the daily charts
remain in control of both the S&P and Nasdaq markets, a pace which both swing
and intraday traders should continue to respect until the winds change. Once
again, the market proved that trying to interpret news is clearly a futile and
useless exercise, and to borrow Kevin Haggerty’s phrase for the moment, we’ll
leave the interpretation on the morning employment numbers to the talking heads.
Thankfully, the fueled retail panic (thank you M.B., M.S. et al)
continues to provide outstanding trading opportunities as the opening Globex one
and three minute ES trends turned at 9:34 AM ET and never looked back until
almost 30 points later on the S&P. Even if you were using charts excluding the
Globex session, there was a prime pullback to three-minute support at 10:10 AM
that provided approximately 10 points in potential.
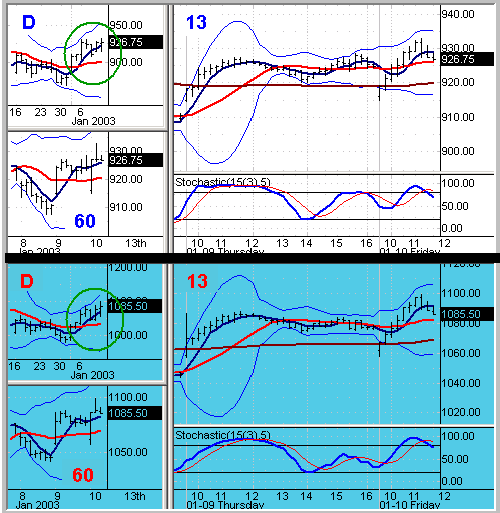
Heading into the afternoon session, the markets are retracing toward 13-minute
trend supports for the first time since the morning bungee, and a turn on the one
and three may provide potential for an tradable bounce as the daily, hourly, and
13-minute trends are all long. At the same time, keeping your eyes on the hourly
and daily stochastics on this current leg of the daily chart to gauge momentum
vs. the price climb may provide clues as to any emerging divergences, as the
markets continue to approach the critical 940 and 1100 areas on the S&P and
Nasdaq, respectively. If weak divergences do develop, it’s merely a heads-up as,
in my view, respect for trends must always overrule momentum indicators, which
is why I encourage trend breaks as lower-risk reversal triggers.
ES (S&P)Â Â Â Â Â
Friday January 10, 2003 11:40 PM ET       NQ
(Nasdaq)

Moving Avg Legend:
5MA
15MA 60-Min 15MA
See
School and
Video for Setups and Methodologies
Charts ©
2002 Quote LLC
Good Trading and Have a Great
Weekend!
Â
