Here’s What The Current VIX Level Could Mean For The Market
The September S&P
futures (SPU and ESU) were able
finish higher in what proved
to be a volatile week on Wall Street. Equities made many wild swings, which
largely stemmed from events and rumors out of Iraq, not to mention large moves
in the bond market. In addition, earnings reports were mixed overall, which
only added to the volatility.Â
The September S&P 500 futures closed Friday’s
session with a gain of +16.50, and finished at the week’s high for a gain of
+6.25. Volume in the September ES was estimated at 700,000 contract, off from
Thursday’s pace but still pretty decent for a Friday.
The contract reversed off that
triple support level in the 977-73 area that I mentioned on Thursday, and
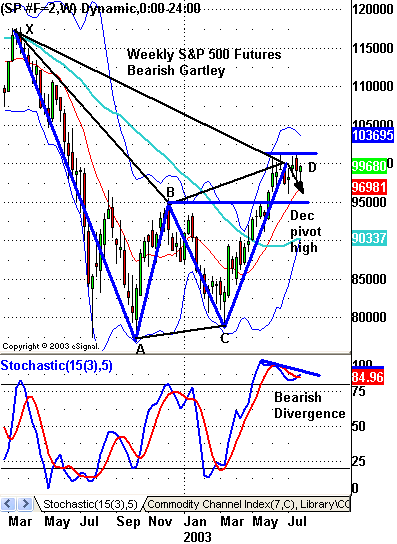
managed to close back above its 20-day MA. On a weekly basis, nothing has
really changed. The SPU and ES continue to show divergence within a bearish
Gartley pattern that gives a target to the December 2nd pivot high in the 950
area (see chart). The VIX closed at its lowest level since March 2002 and is at
a level that historically has marked at least a short-term top. However, I’m
sure the pundits will be all over the financial channels the next few days
spouting off with their catch phrase from the past 3 years, which is “It’s
different THIS time.â€Â The wild card with any of these scenarios, of course,
would be the capture or killing of Saddam Hussein.
Looking
ahead this week, the economic calendar heats up again starting with Tuesday’s
Consumer Confidence report, which is expected to rise to 85.0 from June’s 83.5.Â
The economic action comes to a head on Friday with 9 different reports, most
notably the July Unemployment Rate and ISM Index. Despite all the large swings
we have seen recently, which has been absolute heaven for intraday traders and
absolute hell for swing traders, the S&P 500 (SPX) is right about where it was
in mid-June. The interesting thing is that the news flow has been overly
positive lately, but the index has lacked the momentum needed to break out of
its 5-week range. A case can be made that a consolidation process is underway,
which could provide a launching pad for new highs. At the same time, one can
also very easily suggest a broad topping pattern is forming, given how anemic
stocks have acted every time the index has tested its June highs. I understand
that the market is going through a period where valuations don’t matter for the
moment, however, history has taught us that market players can act irrational
only for so long. With that said, it’s probably best to take our cue from the
market and let it tell us what it wants to do.
Daily Pivots for 7-28-03
| Symbol | Pivot | Â Â Â Â Â R1 | R2 | R3 | S1 | S2 | S3 |
| COMP | 1715.83 | 1745.78 | 1760.85 | 1790.80 | 1700.76 | 1670.81 | 1655.74 |
| INDU | 9218.09 | 9351.05 | 9417.53 | 9550.49 | 9151.61 | 9018.65 | 8952.17 |
| NDX | 1264.79 | 1291.83 | 1305.35 | 1332.39 | 1251.27 | 1224.23 | 1210.71 |
| SPX | 991.60 | 1005.79 | 1012.89 | 1027.08 | 984.50 | 970.31 | 963.21 |
| ESU | 989.83 | 1004.67 | 1012.58 | 1027.42 | 981.92 | 967.08 | 959.17 |
| SPU | 990.00 | 1004.50 | 1012.20 | 1026.70 | 982.30 | 967.80 | 960.10 |
| NDU | 1266.50 | 1295.00 | 1309.50 | 1338.00 | 1252.00 | 1223.50 | 1209.00 |
| NQU | 1266.67 | 1294.83 | 1309.17 | 1337.33 | 1252.33 | 1224.17 | 1209.83 |
| BKX | 898.84 | 911.63 | 918.26 | 931.05 | 892.21 | 879.42 | 872.79 |
| SOX | 385.67 | 395.31 | 400.16 | 409.80 | 380.82 | 371.18 | 366.33 |
| QQQ | 31.47 | 32.17 | 32.54 | 33.24 | 31.10 | 30.40 | 30.03 |
| SPY | 99.52 | 101.00 | 101.77 | 103.25 | 98.75 | 97.27 | 96.50 |
| SMH | 31.94 | 32.80 | 33.25 | 34.11 | 31.49 | 30.63 | 30.18 |
Fair Value & Program Levels
Fair Value — (0.90)
Buy Premium — 0.02
Sell Discount — (2.78)
Closing Premium – (1.88)
Please feel free to email me with any questions
you might have, and good luck with your trading on Monday!
Â