Here’s Why I Expect A Very Tradable Move This Week
Although both the Dow
(
$INDU |
Quote |
Chart |
News |
PowerRating) and SPX
(
$SPX.X |
Quote |
Chart |
News |
PowerRating) finished flat,
it was an outstanding trading day for
sequence traders. The Nasdaq
(
$COMPQ |
Quote |
Chart |
News |
PowerRating) ended +0.6%, and the NDX
(
$NDX.X |
Quote |
Chart |
News |
PowerRating) +1.1%, as the techs led. NYSE volume was 1.5 billion, a volume
ratio of 58, and breadth +67.
The initial trade for
those trading the
(
SPY |
Quote |
Chart |
News |
PowerRating)s or futures was the initial Trap Door created by the
usual Jobs Report Mickey Mouse hype. The media’s overemphasis on economic
reports and the ensuing futures action surrounding it is a major asset to the
daytrader. The SPY closed at 92.83 on Thursday and opened at 91.95 on Friday,
down 1.0%. The intraday low was 91.80 on the first bar vs. 91.87, which was the
1.618 Fib extension of the 92.37 – 93.18 leg up on Thursday. If you are a
sequence trader, you took entry above 91.98 from the one-minute chart because
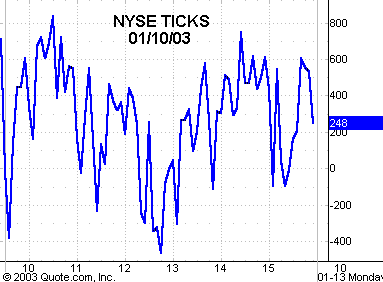
everything turned at once, NYSE TICKS, etc.
From the five-minute
chart you entered above the 92.28 high, which was also an RST buy entry for
those of you that have attended the seminar or purchased the tapes. The rally
carried to 93.64 with nothing resembling a stop. The intraday high was a
wide-range reversal bar with a close in the bottom of the range and was also an
RST sell pattern.
The next bar was your
exit bar for your first trade and also your entry bar on the short, which was
below the 93.35 low. The other reasons you might have exited there was because
93.55 was the 1.27 Fib extension of the Thursday intraday 93.18 high to Friday’s
91.80 low. The trade carried down to the 260 EMA on your five-minute chart at a
92.48 low. The .618 retracement to 91.80 from 93.64 was 92.50. This 92.48 low
was also the signal bar, with the open and close in the top of the range on a
wide-range bar that re-crossed the 260 EMA. Your long entry was above 92.69.
This trade carried up to 93.30 vs. the .618 retracement to 93.64 of 93.20. This
zone halted the advance as the SPY fell off to 92.65, but managed to close at
93.02. It didn’t matter whether you traded the SPYs or futures, you had three
excellent defined opportunities, and some of you may even have taken the fourth.
The
(
SMH |
Quote |
Chart |
News |
PowerRating)s were a
layup as they gapped down to a 24.56 opening, then reversed above that 25.03 Gap
Pullback entry point on the 60-minute chart mentioned in
Friday’s commentary. This trade carried up to 25.90. There was a good second
long entry when the SMHs retraced to and touched the 260 EMA. The low was 25.16
vs. the .618 retracement of 25.07. FYI: For those of you not using a five-minute
chart at all, the 260 EMA on a five-minute chart is the same as a 20-period on a
65-minute chart. The 60 EMA is the same as the 20 EMA on a 15-minute chart. This
way you can look at just one chart if you have a space problem.
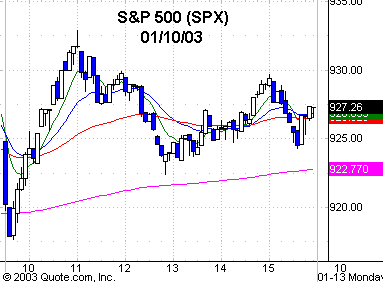
Friday’s SPX close of
927.57 is just above the 30-week EMA of 926.25. The magnets just above are the
.786 retracement to the 954.28 high at 936.13 and the high close since the Oct.
10 low which is 938.87 on Nov. 27. The SPX closed at 934.53 on the Dec. 2 rally
high day of 954.28, as it got rejected at the longer-term head-and-shoulders
neckline. Know the various resistance levels because you can better handle the
intraday setups as they occur. My
Jan. 6 commentary summarizes my observations on any bullish resolution of
this higher resistance zone.
This week has a strong
time symmetry and I expect a very tradable move either way. The major indices
are not quite yet overbought enough or extended to, say, the 2.0 standard
deviation band and have yet to show us a reversal pattern on the daily chart.
Because of the "X" factor being the Middle East news, I will remain 100% hedged
on the position taken on the reversal of the 776 low. The highest probability to
me right now is that there will be a volatile move and the option implied
volatilities for the major indices are at the lower end of the recent trading
range, so therefore, I will put on a delta neutral strategy for one of the major
indices which will enable me to capitalize on this expected increase in
volatility, either up or down. This will complement some existing straddles in
several stocks mentioned in previous texts.
Have a good trading day.

Five-minute chart of
Friday’s SPX with 8-, 20-,
60- and 260-period
EMAs

Five-minute chart of
Friday’s NYSE TICKS
