Here’s why I like the QQQQ’s and SPY’s
The S&P 500 and Nasdaq Composite broke their seven-day winning streaks, as traders and investors returned from last week’s holiday in selling mode. After opening the session slightly higher, the major indices trended steadily lower throughout the entire day and finished at their intraday lows. The small cap Russell 2000 Index showed relative weakness by sliding 1.8% yesterday, while the S&P Midcap 400 Index similarly fell 1.6%. The Nasdaq Composite lost 1.0%, the S&P 500 0.9%, and the Dow Jones Industrials 0.4%.
Obviously, volume was much higher than it was during last Friday’s holiday-shortened session, but turnover was still significantly higher even if you account for the reduced trading hours. Total volume in the NYSE was 176% higher, while volume in the Nasdaq rose 146% over the previous day’s level. As of 1:00 pm EST yesterday, the same time the markets closed on Friday, volume in the NYSE was 48% higher than the previous day and volume in the Nasdaq was 38% higher. This technically makes yesterday a bearish “distribution day,” but it’s not totally accurate to compare yesterday’s volume to a holiday session. More significantly, perhaps, is that volume in both exchanges came in below their 50-day average levels. Conversely, volume during most of this month’s “up” days has been above average levels. The price to volume relationship of the next few days should give us a more clear indication of institutions’ real intentions.
Yesterday’s selloff was broad-based, as nearly every industry
sector we track on a daily basis closed with a loss. The one oddball exception
was the Disk Drive Index
(
DDX |
Quote |
Chart |
News |
PowerRating), which gained more than 1%. Although the
Gold Mining Index
(
GOX |
Quote |
Chart |
News |
PowerRating) closed a bit lower, Spot Gold itself rallied to once again close at a new 17-year high, pulling our long position in
(
GLD |
Quote |
Chart |
News |
PowerRating) (Gold Trust) along with it. Subscribers, however, will notice we are now using a very tight stop to protect gains on the significant profit in this ETF.
The Oil Service Index
(
OSX |
Quote |
Chart |
News |
PowerRating) dropped more than 3% yesterday and appears to be failing to hold at its recent breakout to a new 52-week high. As such, we will be stalking
the Oil Services HOLDR
(
OIH |
Quote |
Chart |
News |
PowerRating) for a potential short entry if it begins to break support on its daily chart.
Now that the markets have begun at least a short-term correction, let’s take an updated look at where the key support levels are in a few of the major broad-based ETFs.
The most basic tenet of technical analysis states that a prior resistance level
becomes the new support level after the resistance is broken. Therefore, we
would expect the prior highs in each of the major indices to now act as support
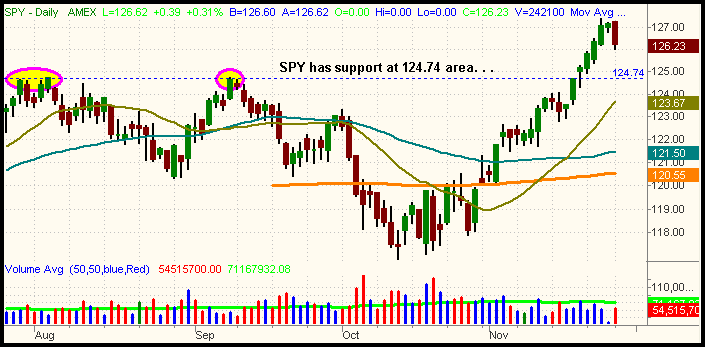
on any subsequent retracement in the markets. Looking at the chart of SPY (S&P
500 Index) below, notice the blue horizontal line at the 124.74 level that marks
the prior highs from August and September. This coincides with 1,245 as support on the S&P 500 Index itself:

To see support of the prior highs on
(
QQQQ |
Quote |
Chart |
News |
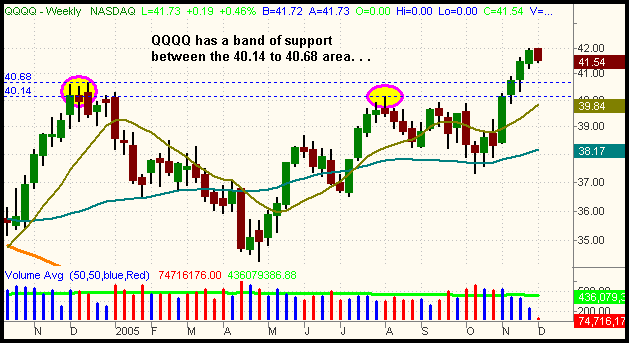
PowerRating) (Nasdaq 100 Index), we need to look at a longer-term weekly chart. The first area of major support comes from the highs of December 2004, while more recent resistance (which is now support) is found at the prior high from August. Both of these areas of horizontal price support are illustrated by the horizontal blue lines on the chart below:

Interestingly,
(
IWM |
Quote |
Chart |
News |
PowerRating) (small-cap Russell 2000 Index) has lagged this month’s broad market recovery. IWM and
(
DIA |
Quote |
Chart |
News |
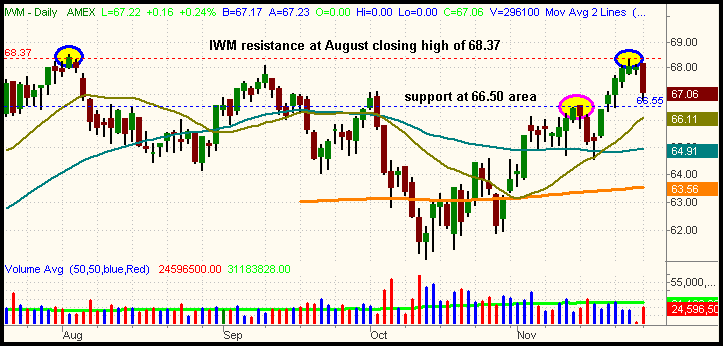
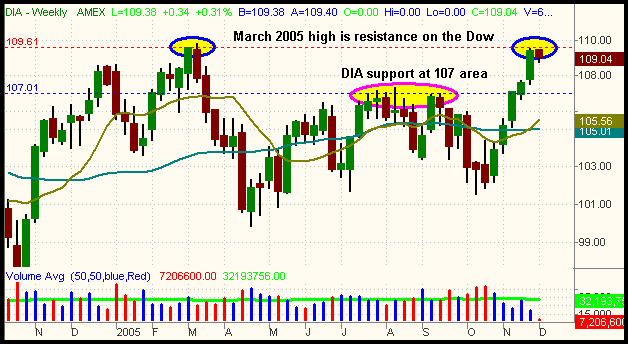
PowerRating) (Dow Jones Industrials) are the only major broad-based ETFs that are not trading at new 52-week highs. This, of course, means that both the Russell 2000 and the Dow Jones Industrials have been showing relative weakness. As such, they are likely to be the first indices to fall when the broad market does and the last to rally when most stocks do. The charts of IWM and DIA below illustrate their support and resistance levels:


As you can see, both IWM and DIA have begun to correct after running into resistance of their 52-week highs. Obviously, this could act as a drag on the broad market. However, it is too early to declare whether or not a “double top” will form on those indices.
Now that you have an idea of where the major indices should find support, the key is to wait patiently to see how well stocks act on the correction. If there is an orderly drop to near the support levels outlined above, we would consider entering some of these ETFs on the long side, particularly QQQQ or
(
SPY |
Quote |
Chart |
News |
PowerRating). However, we do not advise buying DIA or IWM on a pullback because both of those ETFs still have overhead resistance from their prior highs. As we discussed extensively last week, stocks and ETFs at new 52-week highs can easily continue higher, but those with recent price resistance always have a more difficult time. Just as water flowing down a hill will follow the path of least resistance, stocks and ETFs will do the same. Therefore, you should focus on buying only the most solid looking chart setups that are showing relative weakness. Short sales, conversely, remain risky unless the major indices bounce from here and then set “lower lows.”
Open ETF positions:
Long (half) GLD and long TLT (regular subscribers to The Wagner Daily receive detailed stop and target prices on open positions and detailed setup information on new ETF trade entry prices. Intraday e-mail alerts are also sent as needed.)
Deron Wagner is the head trader of Morpheus Capital Hedge Fund and founder of Morpheus Trading Group (morpheustrading.com), which he launched in 2001. Wagner appears on his best-selling video, Sector Trading Strategies (Marketplace Books, June 2002), and is co-author of both The Long-Term Day Trader (Career Press, April 2000) and The After-Hours Trader (McGraw Hill, August 2000). Past television appearances include CNBC, ABC, and Yahoo! FinanceVision. He is also a frequent guest speaker at various trading and financial conferences around the world. For a free trial to the full version of The Wagner Daily or to learn about Deron’s other services, visit morpheustrading.com or send an e-mail to deron@morpheustrading.com .
