Here’s why I’m bullish on the Dollar Index
FX: The
dollar broke below the second trendline support from its 4-week run overnight
has has again rallied to the underside of this broken trendline this morning. We
maintain the view from Tuesday that “This is a typical reaction which is usually
followed by further selling pressure.” In Elliott Wave terms we look to have
completed “wave A” this morning and are bouncing in “wave B” right now which
should be followed by “wave C” down over the coming days. Readers should recall
that we said last week to expect a 3-5 day pullback in the dollar due to bearish
momentum divergences on the 4 and 8 hour charts.
Most encouraging is that the dollar bulls are buying the dips aggressively. If
they fail to take out last week’s highs then we will probably see the final
decline that we are expecting. This will set up the next buying opportunity as
we show below in our FxSignalZone service (due to launch next week).
For the dollar index we think that if the 91.00 resistance holds we should see a
pullback to 89.50 before higher (see chart below).

To clarify, we list below our trades with some
updated comments.
Jan 3: Short USD/MEX @ 10.63 — Looking to add at higher levels possibly.
Jan 3: Long AUD/USD @ 07350 — Closed 1/2 @ 0.7525. Added at 0.7370 and booked
profit at 0.7435. Added again at 0.7370. Looking to take 1/2 profits again at
0.7440.
Jan 6: Long USD/CHF @ 1.2720 — Added at 1.2800. Then again at 1.2920, and again
at 1.3010. Took 1/2 profits at 1.3130 on Feb 17. Looking to add back in the
1.29/1.30 range.
Jan 9: Long USD/CAD @ 1.1660 — Added at 1.1415 for an averaged rate of 1.1575.
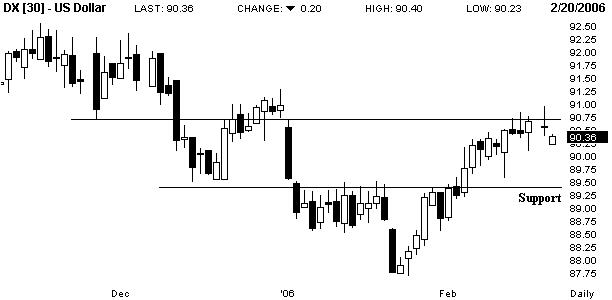
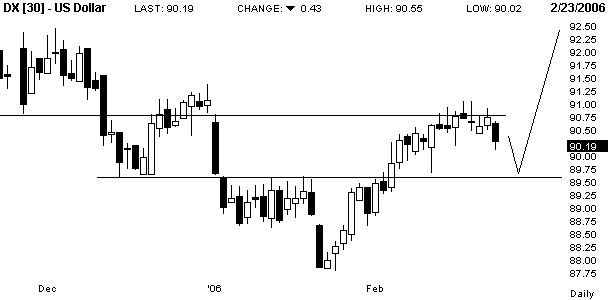
Recommended longs from 88.00. Added on a
sustained move above 89.50. Look to add more above 91.00.
Gold: Gold has failed to see a bullish
resolution to the three day sideways holding pattern. A move below $545 would be
the first sign that we could perhaps break the $535 lows. But until then gold is
still pointed higher and the “ABC” type correction from the $475 is looking like
gold wants to run some more. The critical support is now at the previous
resistance turned support at $540/$535. That must be broken to provoke more
selling pressure.
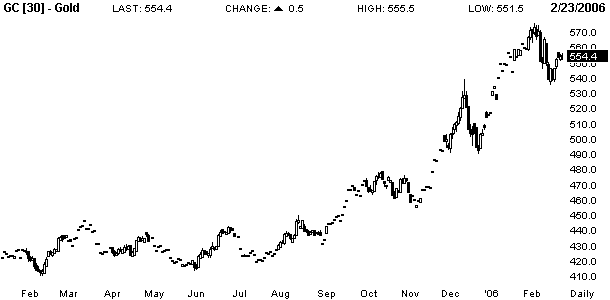
We have recommended option protection for four
weeks for those that are long. We also said shorting on a break of trendline
support at $565 was a good trade for aggressive traders. We don’t like selling
gold but traders that are short from the break below $565 should place stops at
cost or just above the $574 highs.
Stocks: The market rallied to 1293 last
night and looks to be pulling back to 1281 support this morning. That would set
up a final move to MARGINAL new highs just above the 1,300 level which would be
a good selling opportunity.
As you know, we have been saying for weeks that we must see a “five wave”
decline from the 1,300 highs take us below the key 1,245 level (about 1252 in
the futures). So if the market is supposed to top then we HAVE to fall below
1,245 to get the downside moving. Otherwise the trend remains in favor of the
bulls. This is why we have said for three weeks that “We still think traders can
look to go short with risk limited to 1,300. But a more pragmatic approach is to
wait for a completed “five wave” move below 1245 to confirm a top.”

Go short with risk above 1,300. Add to position
on a move below 1245.
Bonds: No change: Notes are bouncing from
clear support at 107 after completing a “five wave” move down into this support
zone. We expect to see a bounce followed by a sustained move below here which
should really see an increase in selling pressure considering that the
speculators are heavily net long. We have recommended shorts from 109 and noted
that breaking key resistance at 4.5%-4.7% could really ignite some selling
considering that the market is bearish on bonds but positioned the highest net
long in 3 years.

Recommended shorts from 109. Taking profits near
the support zone is ideal. Otherwise, trailing stops should be placed just above
109.15.
Crude Oil: No change: This week’s jump in
oil means that if “wave C” does not move to below “wave A” then it is not an
“ABC” zigzag type correction. Instead it would be part of a larger “ABCDE”
triangle pattern. Only a sustained move below $56 would indicate that this was
an “ABC” type correction and still then oil would be a good buy around $55 where
we last recommended to go long.
Either way we have not changed our view that the pullback from the “wave (III)”
peak at $70 would see some sort of “wave (IV)” correction followed by a
sustained move to $80-$100. The only uncertainty is how we were to get there.
Therefore, as we said last week, “We see an opportunity for those that are
bullish to buy in the $60 area over the coming days to weeks.”
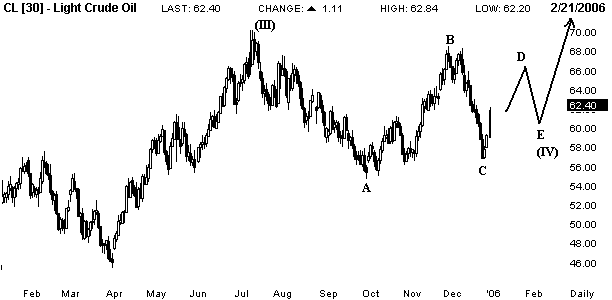

Recommended long at $55 last November. Still
looking for a move to $80-$100 over the coming months.
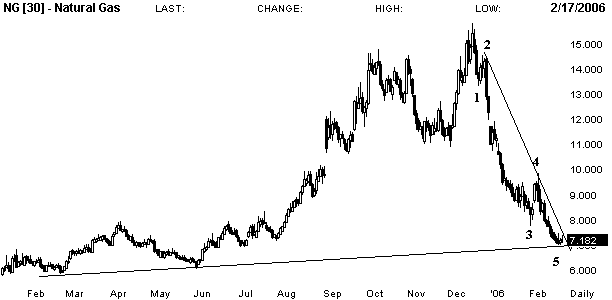
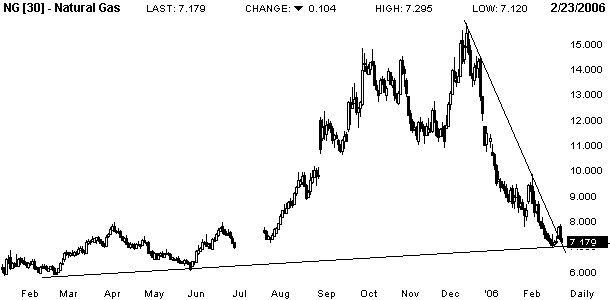
***** We’re starting to turn up from support after the clear “five wave” move
down to extremely oversold levels with extreme bearish sentiment. We said this
“is the typical setup for a rip roaring rally. Those who are looking to go long
this market should right now as it completes “wave 5” right on trendline
support.” Some of you have gone long and thanked us for the tip. To you we say,
“Hold on to your hats” and enjoy the ride.
Â
Jes
Black is the fund manager at Black Flag Capital Partners and Chairman of
the firm’s Investment Committee, which oversees research, investment and
trading strategies. You can find out more about Jes at
BlackFlagForex.com.
Prior
to organizing the hedge fund he was hired by MG Financial Group to help
run their flagship news and analysis department,
Forexnews.com. After four
years as a senior currency strategist he went on to found
FxMoneyTrends.com – a research firm catering to professional traders.
