Here’s Why You Should Be Aware Of Relative Relationships
The
major indices finished small to the red side, but almost unchanged.
There was some more decline, and we did
get a contra move, and in fact, one good long and short play in the SPX
(
$SPX.X |
Quote |
Chart |
News |
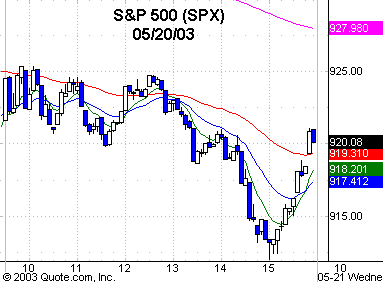
PowerRating). (See yesterday’s commentary.) The SPX was choppy until a
second-entry short trade, as the SPX broke that 920 minor support on the 1:25
p.m. ET bar and traded down to a 912.05 intraday low, where there was an
inside-bar-pattern entry above 913.42 on the 3:10 p.m. bar. If you took the
entry on the 2:50 p.m. bar above 914.37, that wasn’t wrong. But if you scratched
the trade at a small loss, you still had to take the second setup with entry
above 913.42. The reason you did was because the SPX 200-day EMA is 909, the
.236 retracement to 789 is 911, and the 20-day 30-minute 2.0 standard deviation
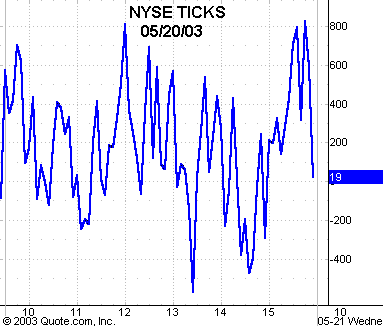
band was about 915, which I had mentioned to you. Also, the NYSE ticks had a
positive divergence, making its low on the 2:45 p.m. bar and rising from there
on higher lows into the 3:10 p.m. entry bar. The 8, 3, 3 slow stochastic on your
five-minute chart also had a positive divergence. I will be covering this kind
of trade logic and detail in the
June seminar.
As I do this, the
pre-market Dow futures are -40, Nasdaq -8, and the S&Ps -4. Next, we go through
our daily drill of preparing the morning’s awareness levels for intraday trades.
The Dow
(
$INDU |
Quote |
Chart |
News |
PowerRating) closed at 8491, with the 200-day EMA at 8495. If the
futures hold red, then you have the 50-day EMA at 8395, which is also the 1.27
extension of the last leg up yesterday, provided yesterday’s lows on the Dow are
taken out. In addition, the 89-day EMA is 8350, the 200-day SMA is 8326, then
the .382 retracement to the March 12 low of 7417, which is at about 8237.
If you check the Dow
stocks, you’ll see that
(
CAT |
Quote |
Chart |
News |
PowerRating),
(
DD |
Quote |
Chart |
News |
PowerRating),
(
C |
Quote |
Chart |
News |
PowerRating) and
(
GE |
Quote |
Chart |
News |
PowerRating) have all pulled
back to their 50-day EMAs, so they go on today’s scroll list. In addition to the
SPX levels mentioned earlier, there is a confluence below at 884, 885 and 888.
When I look at the MDY, IJR and IWM, which is the Russell 2000 iShares, it is
clear that there is no edge unless there is some further retracement. In the
sector SPDRs, the XLB and XLK are back to their 200-day EMAs, while the XLF
closed at 23.40, with the 200-day EMA down at about 22.70.
The point of this
exercise is to get you thinking about relative relationships and focusing on the
various vehicles where there might be an edge or at a level that might get
active. My approach as a trader is always top down, which is market, sector,
group and stock.
Have a good trading day.

Five-minute chart of
Tuesday’s SPX with 8-, 20-,
60- and 260-period
EMAs

Five-minute chart of
Tuesday’s NYSE TICKS
