Here’s Why You Should Pay Attention To Descending Triangles
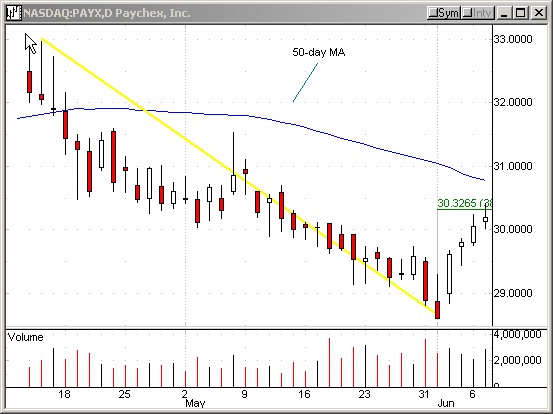
Paychex Inc (PAYX)
closed just below the 38.2% retracement level yesterday after pulling
back from the June 1 low. Naturally, we are looking for a resumption of the
downtrend.

10:12:17 (from TradersWire) The clock is
3 minutes fast.
![]()
|
Action |
Symbol |
Order Type |
Setup |
Stop |
 Target |
Current Price |
Posted By |
|
Sell |
PAYX | sell stop at 30.24 | testing intraday support | 30.36 | 30 | 30.27 |
TK |
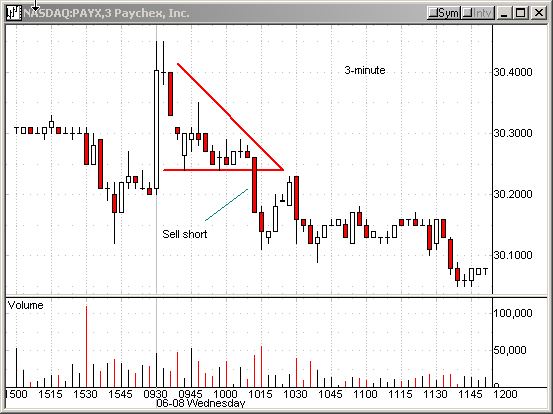
Let’s look at the 3-minute chart
from this morning. The issue opened with a strong wide range bar, but it failed
to sustain its momentum. Sellers moved in, and the stock formed a descending
triangle. This was a potential breakdown situation. I placed a sell stop at
30.24.
10:20:55
Follow up on PAYX
We are covering half to take a 12-cent gain. Adjust stop to breakeven.

If you have questions, feel free to
mail them to me.
Â
