High PowerRating, Low RSI: A Winning Combination for Traders
When you think of great pairs what comes to mind? Abbott and Costello? Batman and Robin? Lennon and McCarthy?
When it comes to short term stock and ETF trading, my favorite pair is a high Short Term PowerRating and a low 2-period RSI.
Why? Because both tools are among the best for short term stock and ETF traders who are looking to buy stocks and ETFs when they are on sale, and to sell them when eager shoppers are lined up around the block just waiting to buy.
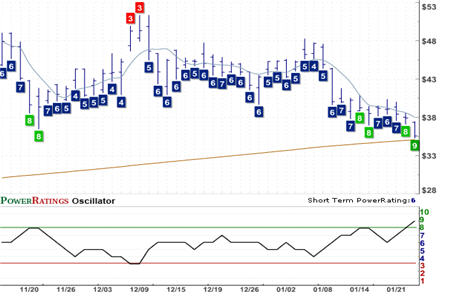
Almost Family Inc.
(
AFAM |
Quote |
Chart |
News |
PowerRating) Short Term PowerRating 9. RSI(2): 1.56
Our Short Term PowerRatings are a quantified approach that ranks stocks based on a variety of characteristics including trend, volume, volatility and momentum. We found in our historical testing going back to 1995 and involving millions of simulated stock trades, that our highest Short Term PowerRatings stocks have outperformed the average stock by a margin of nearly 17 to 1 after five days. This is a powerful edge for short term traders looking for opportunities – to the long side or the short side – in these volatile markets.
But all high Short Term PowerRatings stocks are not created equally. What can we do, for example, when confronted with a number of stocks all with the sort of high Short Term PowerRatings that mark them as potential trading candidates?
Here is where the 2-period RSI comes in handy. The 2-period RSI is one of the best indicators for traders looking to pinpoint just how overbought or oversold a stock or ETF actually is. When we find stocks, for example, with 2-period RSIs in the low single digits – or ETFs with 2-period RSIs under 30 – we know we are looking at markets that have likely undergone panic selling, driving these markets to oversold extremes. And in these extremes, according to our research, often lies significant upside opportunity for short term traders of stocks and ETFs.
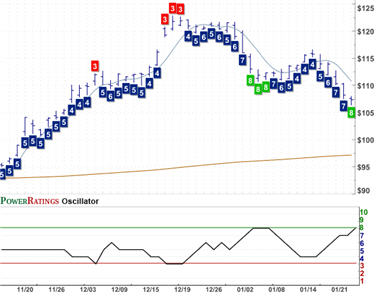
iShares iBoxx Investment Grade Corporate Bond ETF
(
LQD |
Quote |
Chart |
News |
PowerRating) Short Term PowerRating 8. RSI(2): 0.811
So when looking at the Short Term PowerRatings of potential trading candidates, be sure to check 2-period RSIs, as well, to see which candidates are truly the most oversold (or overbought, if selling short). Similarly, when scanning 2-period RSIs of stocks and ETFs, check to see if their Short Term PowerRatings reflect the same level of opportunity suggested by the indicator. This is a sure way to improve the quality of your trades and, potentially, the quality of your short term trading results as well.
Does your stock trading need a tune-up? Our highest Short Term PowerRatings stocks have outperformed the average stock by a margin of nearly 17 to 1 after five days.
| Click here to start your free, 7-day trial to our Short Term PowerRatings! |
Whether you have a trading strategy of your own that could use a boost or are looking for a way to tell the stocks that will move higher in the short term from the stocks that are more likely to disappoint, our Short Term PowerRatings are based on more than a decade of quantified, backtested simulated stock trades involving millions of stocks between 1995 and 2007. Click the link above or call us at 888-484-8220, extension 1, and start your free trial today.
David Penn is Editor in Chief at TradingMarkets.com.