High Probability ETF Strategies: The Most Overbought ETFs in the World
Most of the time, high probability ETF traders are focused on ETFs that are pulling back and moving into oversold territory. This is because high probability ETF trading strategies are based on a mean reversion approach to short-term trading.
This mean reversion approach means that, in Larry Connors’ phrase, we are “buying the selling and selling the buying.” High probability ETF traders wait for ETFs to begin selling off before stepping in to buy funds that the market has put on sale. After these ETFs have recovered and begun moving higher, high probability ETF traders look to “exit on strength” by selling these funds back into the market after they have recovered in value.

One exercise that can be fruitful for high probability ETF traders is to scan the ETF market not just for ETFs that are pulling back, but also for ETFs that — in all likelihood — will be pulling back in the future. Because a mean reversion strategy also implies that those ETFs that extend the farthest away from their mean are those that often pullback the sharpest when profit-taking begins (and, perhaps more importantly, when profit-taking turns into panic-selling).
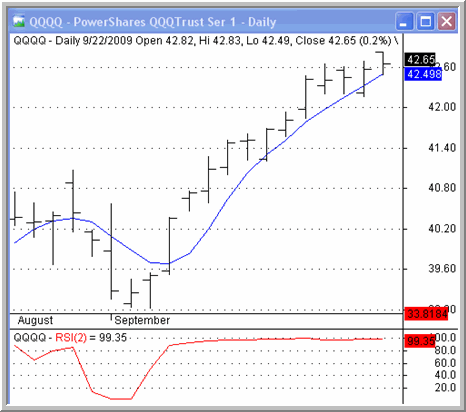
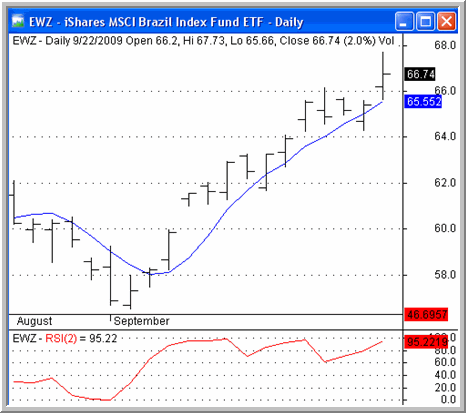
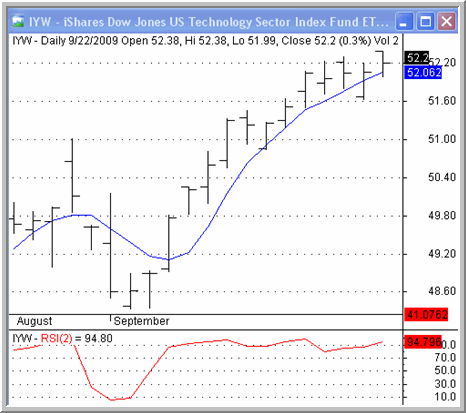
To that end, I’ve included three charts of some of the most overbought ETFs in our database. I focused on overbought country and equity index ETFs insofar as those ETFs have performed the best in our ETF testing. These are funds that have made a good amount of money for traders in recent days and, in the event that traders begin taking profits over the next few days, any of these funds could be potential targets for high probability short term trades.
Right now, the most overbought ETF in the world is the PowerShares QQQ Trust ETF
(
QQQQ |
Quote |
Chart |
News |
PowerRating). I have been noting this ETF in my 7 ETFs You Need to Know column and its overbought streak has only intensified. The QQQQ (top most chart above) has closed in overbought territory above the 200-day moving average for an eye-popping 12 consecutive trading days. 9 of those 12 days have featured 2-period RSI values of 98 or more.
Most overbought country ETF? Right now, that award goes to the iShares MSCI Brazil Index ETF
(
EWZ |
Quote |
Chart |
News |
PowerRating).

EWZ has spent 11 out of the past 12 days in overbought territory above the 200-day. As of the close on Tuesday, EWZ had vaulted higher by another 2%.
Lastly, let’s take a look at the most overbought sector ETF in our ETF database.

As far as sectors go, the most overbought sector ETF trading above the 200-day moving average is the iShares Dow Jones U.S. Technology Sector Index Fund ETF
(
IYW |
Quote |
Chart |
News |
PowerRating).
Like the QQQQ, the iShares Dow Jones U.S. Technology Sector Index Fund ETF has closed in overbought territory above the 200-day moving average for 12 consecutive trading days — revealing IYW to be an extremely overbought market. The ETF has shown some selling pressure intraday, but that pressure has not be enough to draw the fund down out of overbought territory.
With Larry Connors’ High Probability ETF Trading Software, retail traders have access to the same kind of “buy the selling, sell the buying” trading strategies that professional traders have used successfully for decades.
Click here to start your free trial to Larry Connors’ High Probability ETF Trading Software today!
David Penn is Editor in Chief at TradingMarkets.com.
