High Probability ETF Trading: Entries, Exits and Energy ETFs
3 exchange-traded funds – 3 backtested strategies – 3 profitable exits.
I have been writing frequently over the past several days about oversold conditions in energy-related exchange-traded funds (most recently in my “Ultimate PowerRatings Trading Report: Opportunities in Tech, Energy and Asia” article).
For traders who have been taking advantage of these oversold conditions (“buying the selling” in Larry Connors’ signature phrase), Monday’s rally was an excellent profit-taking opportunity. In fact, based on the results from our High Probability ETF Trading Software (click here to launch your free trial), there were a wide number of exits in a variety of ETFs based on Monday’s strength.
And many of those exits – profitable exits – were in energy ETFs.
All the more interesting is that these winning setups came courtesy of a variety of different backtested, quantified high probability ETF trading strategies – all from the book by Larry Connors and Cesar Alvarez, High Probability ETF Trading.
IEO and the 3 Day High/Low Method
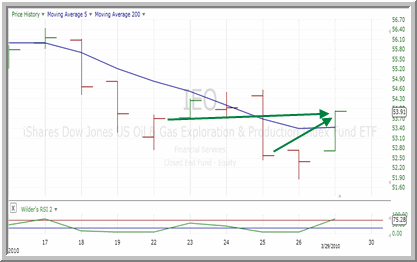
One of the exits on Tuesday came from an opportunity in the ^IEO^. A number of different strategies suggested trading set-ups in IEO over the past few days, including the 3-Day High/Low Method.

In short, the 3-Day High/Low Method is based on spotting oversold markets based on multiple lower highs and lower lows. This strategy called for buying one unit in IEO on March 22nd and a second unit when IEO closed lower still a few days later. By Tuesday, traders would have been able to lock in gains in the IEO with a modest, high probability gain of nearly 1.5%.
Multiple Down Days and XLE
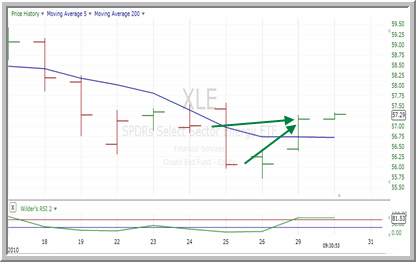
Similar to the 3-Day High/Low Method, the Multiple Down Days (MDD) Strategy also looked to take advantage of oversold markets. Here, we look for ETFs that have closed lower more often than not in the past few days. One nice thing about the MDD Strategy is that you don’t have to have consecutive selling days in order to trigger the set-up. Four down days out of five is plenty.

Following the MDD Strategy with another energy ETF – the ^XLE^ – a trader would have picked up one unit on March 24th and a second unit when the XLE closed lower still the next day. A Tuesday exit, as XLE crossed back above its 5-day moving average, would have provided traders with a gain of more than 1% in four days.
IGE and RSI Extremes
Most traders who are familiar with the work of Larry Connors and Connors Research know that they have done a great deal of work with the Relative Strength Index. In this final example, we’ll look at a way to use the Relative Strength Index to help spot ETF markets when they reach oversold extremes.

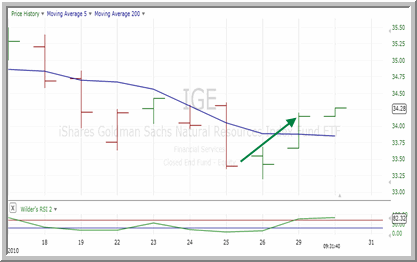
The RSI 10/6 Strategy simply calls for buying ETFs trading above their 200-day moving averages when their 2-period RSI drops below 10. The “6” in the RSI 10/6 Strategy means that traders should buy an additional unit if the ETF closes with a 2-period RSI of less than 6.
In the case of the ^IGE^ (I know, not strictly an “energy”), traders would not have been able to pick up a second unit long. But by waiting for the RSI to reach extremely low levels (10 or below), traders would have made out exceptionally well in this trade. Long at 33.39 on March 25th when the IGE fell to oversold extremes, IGE’s rally on Tuesday above the 5-day moving average meant that traders could exit with gains in excess of 2%.
With Larry Connors’ High Probability ETF Trading Software, short term traders have access to the same kind of “buy the selling, sell the buying” trading strategies that professional traders have used successfully for decades.
Click here to start your free trial to Larry Connors’ High Probability ETF Trading Software today!
David Penn is Editor in Chief at TradingMarkets.com.
