High Probability ETF Trading Report – Country ETFs and the 200-day: EWZ, EWJ, RSX
So you’re looking at your charts of exchange-traded funds (ETFs) and spotting oversold ETF after oversold ETF pulling back above their 200-day moving averages. The sell-off to end the holiday-shortened week on Thursday was broad-based, sending country ETFs, sector ETFs and even many commodity ETFs reeling. For a high probability ETF trader who looks to buy into the selling and sell into the buying, opportunities for potential trades to the long side appear plentiful.
So how does a high probability ETF trader choose which ETFs to focus on?
We know that sector ETFs tend to revert to the mean more consistently than commodity funds. And we know that country ETFs tend to do an even better job of mean reversion than do sector ETFs. So, given a large number of potential trading opportunities, focusing on country ETFs over the next few days as the markets continue to sell-off, is a sound approach.
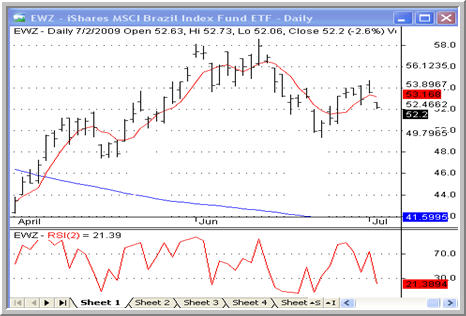
iShares MSCI Brazil Index ETF
(
EWZ |
Quote |
Chart |
News |
PowerRating)
But how can traders choose between country ETFs to find those that are most likely to respond to oversold conditions with a strong bounce higher?
One strategy that high probability ETF traders can use is to first eliminate all those country — and equity index ETFs, which are essentially U.S. country ETFs — that are trading within 1.5-2% of their 200-day moving average.
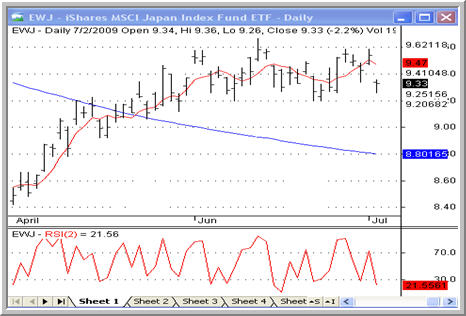
iShares MSCI Japan Index ETF
(
EWJ |
Quote |
Chart |
News |
PowerRating)
Why? Larry Connors and Cesar Alvarez discovered in their research on ETFs that as they approached their 200-day moving averages — either from above or below — volatility increased significantly. This is understandable insofar as the 200-day moving average is a decisive level for many large and institutional traders. One way for traders to avoid this volatility is to avoid ETFs that are trading close to their 200-day moving averages. Larry and Cesar found that a distance of 1.5% was sufficient.
Market Vectors Russia ETF
(
RSX |
Quote |
Chart |
News |
PowerRating)
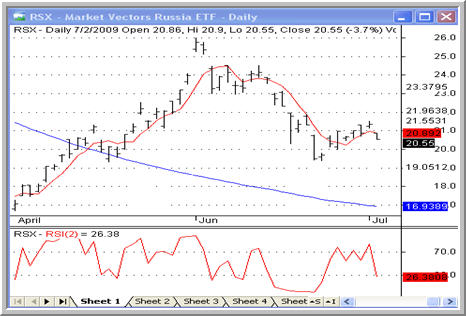
All three of the ETFs in today’s report are not only ETFs that are pulling back above their 200-day moving averages, but also are trading at least 1.5% above their 200-day moving average — despite severe pullbacks in some instances. Continued weakness in these country ETFs may provide excellent high probability trading opportunities in the days to come.
According to a recent report, eight out of ten securities traded are exchange-traded funds. Want to learn how to trade them? Click here to order High Probability ETF Trading,the first quantified book of trading strategies to improve your ETF trading.
David Penn is Editor in Chief at TradingMarkets.com.