High Probability ETF Trading Report: DOG, DXD, TWM, RWM, SDS
When markets are oversold, some of the best opportunities for short term high probability ETF traders can be found on the short side. What?! The short side?!
The short side of inverse and short ETFs, that is. Aggressive selling in stocks, the kind of selling that creates tradable oversold extremes, tends to send inverse and short ETFs soaring. And when those ETFs are moving higher from below their 200-day moving averages, then they are just as vulnerable to reversal as any regular, non-inverse ETF.
Today’s High Probability ETF Trading Report underscores a number of short or inverse ETFs — two representing the Dow, two representing the Russell 2000 and one representing the S&P 500 — that are both overbought and trading below their 200-day moving averages. Increasing pessimism is helping drive these inverse ETFs higher in the first half of July and once that pessimism runs its course, these overbought inverse ETFs are likely to encounter significant selling. The goal of the high probability ETF trader is to be short these kind of ETFs before that selling begins.
This, by the way, is why it is important to wait for markets to reach extreme levels before taking a position.
Let’s take a closer look at some of these overbought inverse ETFs:
The ProShares Short Dow 30 ETF
(
DOG |
Quote |
Chart |
News |
PowerRating) is only a little more overbought than its leveraged brethren, the ProShares UltraShort Dow 30 ETF
(
DXD |
Quote |
Chart |
News |
PowerRating).

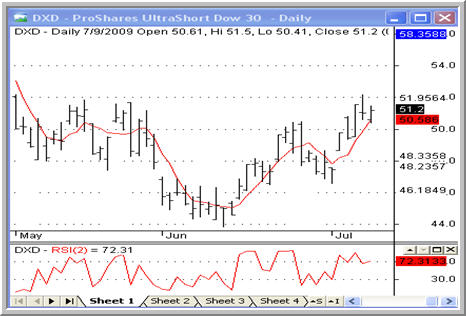
DXD entered overbought territory below the 200-day on Tuesday, pulled back from that area on Wednesday and moved back into overbought territory on Thursday. A second overbought close will likely draw the attention of mean reversion traders looking for ETFs moving deeper into extreme overbought territory.
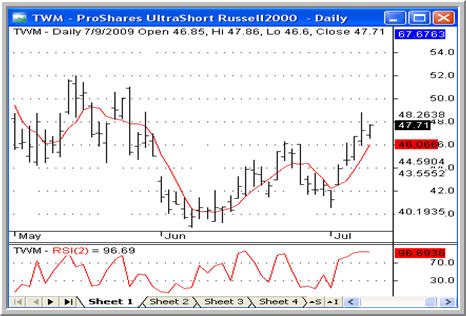
On the other side of the market cap spectrum, two ETFs representing the Russell 2000 are also in overbought territory below the 200-day. In this instance, the leveraged version is somewhat more overbought than the non-leveraged version — by a very small margin.

TWM has closed higher for three days in a row, closing in overbought territory below the 200-day for a remarkable five consecutive trading days. For the past three days in a row, TWM has had a 2-period RSI of more than 90.
The last overbought inverse ETF I want to look at this morning is the ProShares UltraShort S&P 500 ETF
(
SDS |
Quote |
Chart |
News |
PowerRating).

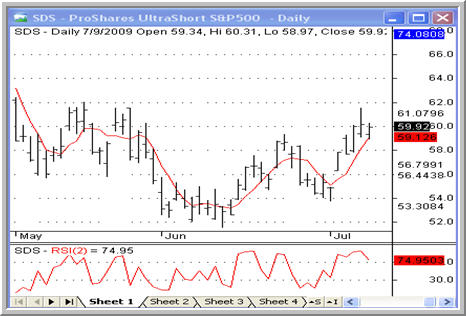
SDS has also closed higher for the past three days in a row. Tipping above 90 in its 2-period RSI on Wednesday, SDS pulled back on Thursday, though remaining in the overbought zone.
One note for high probability ETF traders working with leveraged ETFs. Because of the 2-to-1 leverage involved in many of these inverse ETFs (DXD, TWM and SRS), traders may want to cut their usual trading size in half. Otherwise, a trader may end up inadvertently taking on twice as much risk as anticipated. Remember that overleveraging is one of the biggest threats to trading success. So remain patient, pick your shots, and stick with the biggest and best quantified edges.
According to a recent report, eight out of ten securities traded are exchange-traded funds. Want to learn how to trade them? Click here to order High Probability ETF Trading, the first quantified book of trading strategies to improve your ETF trading.
David Penn is Editor in Chief at TradingMarkets.com.
