High Probability ETF Trading Report: The Last of the Overbought ETFs
On the one hand, we have a market that is filled with overbought ETFs. Whether you are looking at country ETFs like the iShares MSCI Japan Index ETF
(
EWJ |
Quote |
Chart |
News |
PowerRating), which has closed with a 2-period RSI of more than 90 for the past three days in a row, or equity index ETFs like the PowerShares QQQ Trust ETF
(
QQQQ |
Quote |
Chart |
News |
PowerRating), which has closed with an RSI(2) of more than 99 for four consecutive trading days, buying pressure in many of the kind of ETFs that we like to trade has been immense.
On the other hand, when it comes to actually trading overbought ETFs, we know that we are interested only in those overbought ETFs that are trading below their 200-day moving averages. This is what our historical research tells us, going back to the inception of many of the most widely-traded ETFs: the greatest short term edges are in buying oversold ETFs above the 200-day moving average and in selling short overbought ETFs below the 200-day moving average.
In the context of the current market, this reduces the number of potential overbought trades (short trades) dramatically. As of the Wednesday close, for example, there were only five ETFs in our database that were both overbought and trading below their 200-day moving averages.
Let’s take a look at three of these ETFs insofar as they also represent three areas: oil/energy, commodities in general, and real estate that are very much in the news these days, news that may distract traders from a sound strategic approach to dealing with these potential, short-term opportunities.
The iShares GSCI Commodity Index Trust
(
GSG |
Quote |
Chart |
News |
PowerRating) began moving down from its most overbought extremes on Wednesday, but the ETF remains among the few overbought ETFs still below its 200-day moving average.
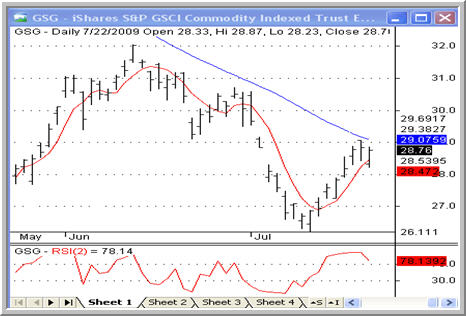
Before Wednesday, GSG had closed with a 2-period RSI of more than 90 for three days in a row.
Looking more specifically at individual commodities, it is clear that buying pressure has been significant in the oil market, pushing ETFs like the United States Oil Fund
(
USO |
Quote |
Chart |
News |
PowerRating) higher.
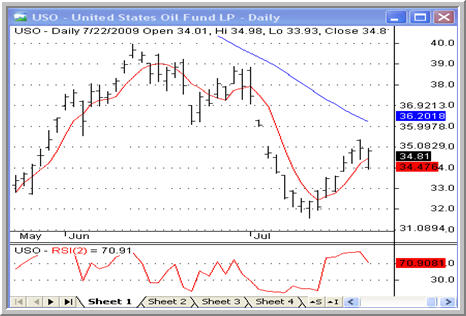
With 2-period RSIs of more than 94 for the past three days going into Wednesday, USO is still an overbought ETF even though shares gapped lower to start the day on Wednesday’s trading.
Moving away from physical assets to financial ones, the ProShares Ultra Real Estate ETF
(
URE |
Quote |
Chart |
News |
PowerRating) has not been as demonstrably overbought as have GSG and USO. URE has been more volatile in that regard, dipping in and out of overbought territory below its 200-day moving average.
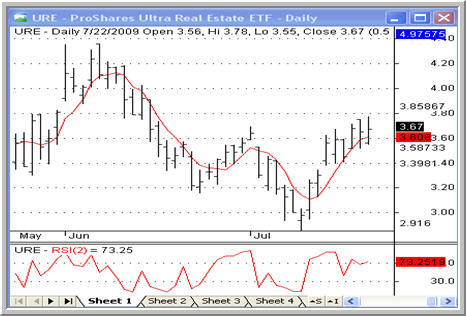
To that end, high probability traders should be on the look out to see if URE is able to close in overbought conditions for at least two consecutive days before considering taking a position in this — or any other overbought ETF trading below the 200-day.
Larry Connors will be conducting a 2 1/2 day High Probability ETF Trading Seminar beginning August 14. If you’d like to attend a free online presentation explaining the concepts of High Probability ETF Trading and introducing the 2 1/2 day Seminar coming in early August, please call 1-888-484-8220 ext. 1 or click here to register today.
David Penn is Editor in Chief at TradingMarkets.com.
Want updates on our latest articles? Have something to say to David Penn or
the staff at TradingMarkets? Follow David on Twitter at @Penn_TM and TradingMarkets at @Trading_Markets. You can also join the
discussion on Facebook by logging onto our fanpage
.