High Probability ETF Trading Strategies: Up Days, Down Days in EWY, KRE, VNQ
One of the more active high probability ETF trading strategies over the past few days has been a strategy from Larry Connors’ new book, High Probability ETF Trading, called Multiple Days Down/Multiple Days Up.
Click here to order your copy of High Probability ETF Trading.
There’s a lot to like about the Multiple Days Down/Multiple Days Up (MDU/MDD) ETF trading strategy. For one, MDU/MDD has been correct more than 73% of the time for long trades, including thousands of simulated, short-term ETF trades since inception. Trades to the short side have been correct more than 70% of the time.
Moreover, there is an “aggressive” version of the MDU/MDD strategy that can potentially provide high probability ETF traders with even greater gains. Using a very simple scale-in strategy, the aggressive version of MDU/MDD has yielded profitable trades in more than 80% of all long trades tested and more than 77% correct in all “aggressive” short trades tested.

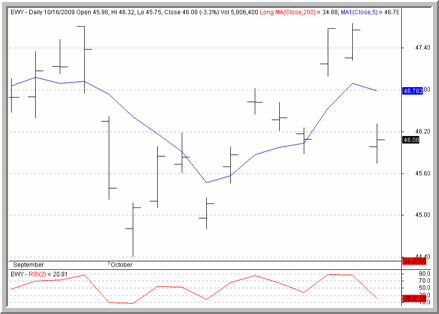
Country ETFs like the iShares MSCI South Korea ETF
(
EWY |
Quote |
Chart |
News |
PowerRating) are often excellent choices for high probability ETF trades.
But one of the things that I appreciate the most about MDU/MDD is that it hardly requires the trader to have any knowledge of technical analysis or technical indicators at all. In fact, once a trader knows whether the ETF he or she is reviewing is above its 200-day moving average but below its 5-day moving average (a criteria for long trades), all he or she needs to be able to do is to tell and up day from a down day.
What the MDU/MDD strategy does it take advantage of another way that oversold (or overbought, in the case of MDU and selling short bounces below the 200-day) markets can express themselves. Sometimes an oversold ETF market will merely plunge lower day after day. But an ETF market can also be oversold if there is an occasional “up day” mixed in — as long as there is evidence of sellers continuing to dominate the market action.

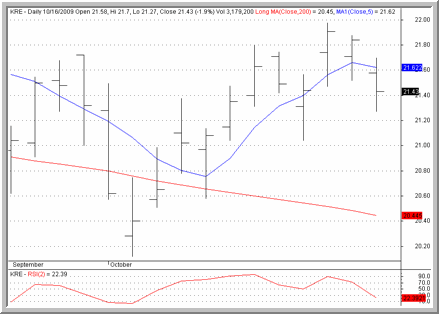
Among many of the ETFs pulling back in recent days are a number from the financial sector. Above is a chart of the current pullback in the SPDR KBW Regional Banking ETF
(
KRE |
Quote |
Chart |
News |
PowerRating).
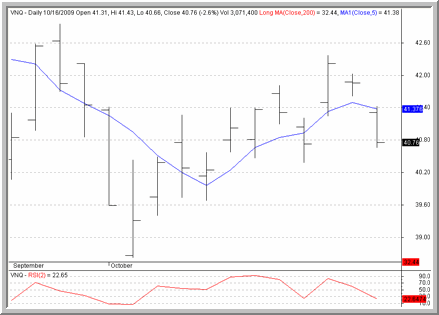
Scattered throughout this column are a few of the potential MDU/MDD setups that have been spotted by our High Probability ETF Trading Software, a software product that scans the market for high probability ETF trading opportunities based on the strategies in the book, High Probability ETF Trading. It is another resource for traders who would rather not scan for trade setp-ups on their own that has become increasingly popular among high probability traders.
Further weakness in these ETFs may represent potential high probability short term opportunities for traders. Keep an eye on these ETFs — as well as others that are making similar patterns of lower closes above the 200-day moving average. The ETFs that pull back today are often the same ETFs that outperform tomorrow.

In addition to regular banks, real estate-related exchange-traded funds (ETFs) have also become increasingly oversold in recent days. Here is a look at the Vanguard REIT ETF
(
VNQ |
Quote |
Chart |
News |
PowerRating).
For your free trial to High Probability ETF Trading Software, click here. Or to order a copy of High Probability ETF Trading, the new book by Larry Connors, click on this link today.
David Penn is Editor in Chief at TradingMarkets.com.
