High Probability Trading Report: Oversold Stocks Soar as Financials Retreat
The pullback that Larry Connors has been alluding to in his “Morning Market Commentary” section of his Daily Battle Plan appears to have arrived. As Larry noted this morning, high probability traders were able to detect the growing weakness – and pullback potential – in this group even before some of the bigger names began selling off.
One excellent way to track the financials is through leading stocks like ^BAC^ and (yes) ^GS^, as well as through major exchange-traded funds like the ^UYG^ and the ^FAS^.
To learn more about Larry Connors’ Daily Battle Plan – more than 80% correct since inception in October 2008 – click here.
Going forward, this weakness means that we should see a significant increase in the number of stocks, exchange-traded funds and leveraged ETFs pulling back to levels from which, according to our testing, they have historically advanced.
Stocks:
Over the past five days, a number of very oversold stocks have rallied into strength. Among these stocks is ^IDSA^, which soared by more than 10% on Monday. The stock is up nearly 14% from its extreme oversold levels from approximately this time last week.
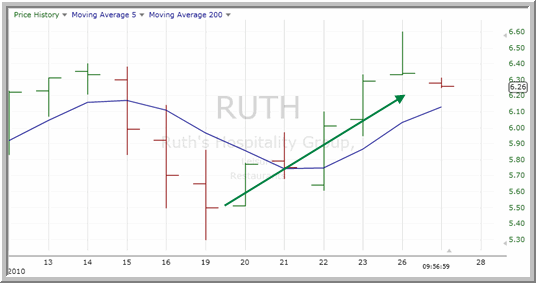
Also making big gains in recent days is previously oversold ^RUTH^.

RUTH fell for three days in a row around the middle of April as it moved toward exceptionally oversold levels above the 200-day moving average. Since then, RUTH has gained more than 15% heading into Tuesday’s open.
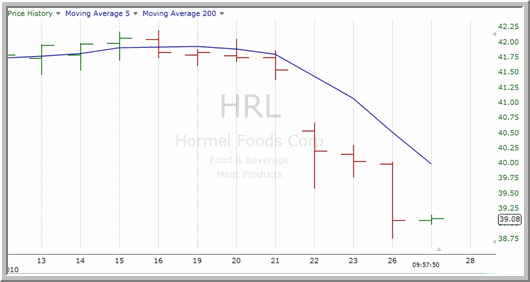
Looking forward, high probability traders in stocks may want to keep their eyes on oversold stocks like ^HRL^, which has plunged more than 6% AFTER closing in oversold territory four days ago.

Exchange-Traded Funds (ETFs):
Our High Probability ETF Trading Software, a unique tool to help short term ETF traders spot the best funds to trade everyday, has spotted a few exchange-traded funds in recent days that have caught the attention of more than one of our high probability ETF trading strategies. Among these funds is the ^EZA^, which reversed lower on Monday after rallying from oversold conditions above the 200-day moving average.
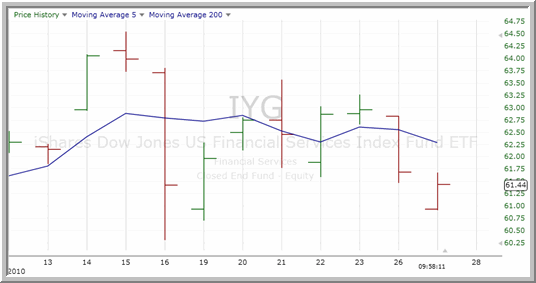
Also worth watching over the next few days is the ^IYG^ (below). IYG closed in oversold territory above the 200-day moving average on Monday and is moving lower today on Tuesday.

With Larry Connors’ High Probability ETF Trading Software, short term traders have access to the same kind of “buy the selling, sell the buying” trading strategies that professional traders have used successfully for decades.
Click here to start your free trial to Larry Connors’ High Probability ETF Trading Software today!
Leveraged ETFs:
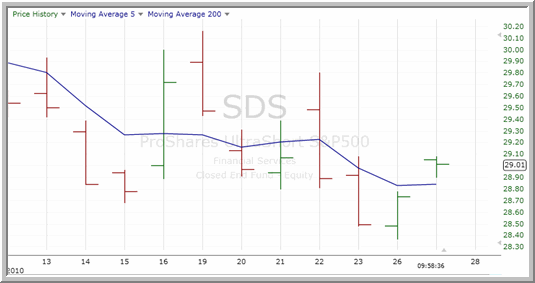
On the leveraged ETF front, we are seeing a number of leveraged funds rally into strength after reaching oversold extremes just a few days ago. For example, consider the bounce taking place in previously oversold leveraged ETFs like the ^QID^ as well as the ^TZA^ and the ^SDS^ (below)

David Penn is Editor in Chief at TradingMarkets.com.
