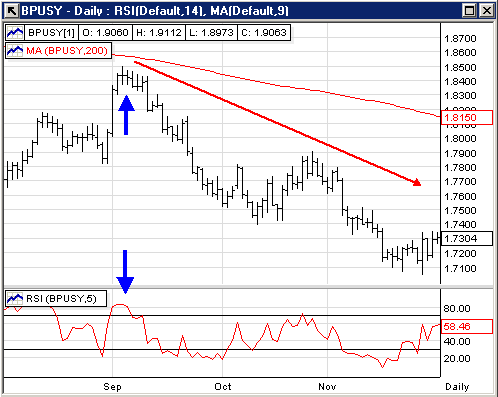
High RSI below 200-day MA and then price takes out previous days low
Are you a forex trader that looks to trade with the trend?
If so, then you probably realize how advantageous it can be to trade with the
trend. In this article, I will show you a special strategy to help you
find downtrending currency pairs that are in the midst of a rally.
First off, we identify the trend using the 200-day simple
moving average.
We are going to consider the case of price being under the 200-day simple moving
average as being in a downtrend. Next we will look for a high 5-period
Relative Strength Index rating of 80 or higher. This tells us that the
particular currency pair is showing strength, while caught in a downtrend.
This provides traders with an opportunity to enter much like a snapback in a prolonged
downtrend.
Most importantly we will be adding the condition that the
current price must be below the previous day’s low. This tells us that
there may be renewed selling and that the trend may resume downwards. Let’s look at
a few examples:

The USD/CAD chart above fulfills all the parameters set above.
Notice the blue arrows. The price is below the red 200-day
moving average line and the RSI (5) reading is above 80 at that level. Also as
the RSI(5) begins to drop the price also falls below the previous day’s close.
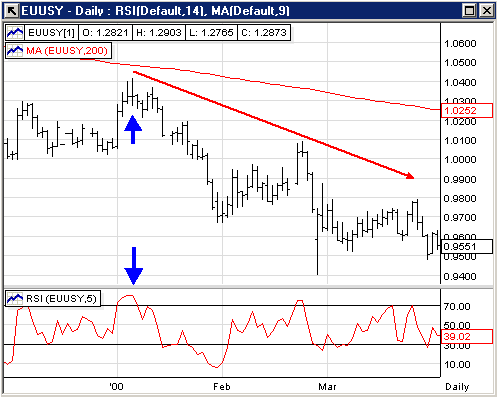
Below are 2 more examples of this potential trade setup.


Please note that it is not an automatic short signal when all
the parameters are met. There are many external factors that may influence
the price. This strategy should be considered along with your own trading
style and goals.
I have enjoyed bringing you this particular shorting technique
and look forward to sharing new ideas and strategies with you in the coming
weeks.
Best regards,
Darren Wong
Associate Editor
