Higher, Higher: 6 Overbought Stocks for Traders
When markets begin to pull back, there are two tasks for the short-term trader. One of those tasks is looking for pullbacks in strong stocks to buy. The other is looking for bounces in weak stocks to sell.
In our Morning Coffee with TradingMarkets pre-open newsletter (click here
to start your free subscription), we have been alerting our readers to the growing dangers of a stock market that is loaded with stocks bearing low Short Term PowerRatings. Today’s sell-off, which has the Dow down by more than 200 points by noon eastern, was an unsurprising response to these dramatically overbought conditions.
When many traders see stocks rising day after day, with consecutive higher closes, they can become almost blindly bullish. Especially when consecutive higher closes occur in a market that has been in decline, the initial sense of relief as stocks close higher day after day is a fairly thorough balm against the discomfort of a declining market.
But short-term stock traders who know and appreciate the TradingMarkets approach to trading understand that consecutive higher highs can be problematic–and all the more so when those consecutive higher highs are taking place below the 200-day moving average.
It may be a bit blunt to put it this way, but for all intents and purposes, nothing “good” happens below the 200-day moving average when it comes to short-term trading of stocks. If you are looking at a stock to trade to the upside and that stock is below its 200-day moving average, then it is time to (a) change your attitude to “short”
rather than “buy” or (b) simply stop looking at that stock.
With this in mind, I selected consecutive higher highs as the TradingMarkets Stock Indicator to screen stocks with this morning. Seeing the futures pointing to a negative open, and knowing that there were significantly more overbought, low PowerRating stocks than oversold, high PowerRating stocks, this indicator seemed like an excellent choice to help uncover weak stocks whose masquerade as strong stocks seemed to have just been exposed.
Why consecutive highs? As we have published in research available here
at TradingMarkets, as well as in Larry Connor’s important book, How Markets Really Work, there is an edge in the short-term when it comes to trading consecutive highs. But that edge is in betting against stocks making consecutive highs, rather than betting for them. And the more consecutive highs a stock makes, the more likely it is to outperform–in the other direction, by moving lower.
When looking at consecutive higher highs lasting five days or more, we found this short-term edge to be consistent in one-day, two-day and one-week time frames. Our research into quantifying this edge has helped reassert the validity of the old trading saw: buy weakness and sell strength, a maxim that is at the cornerstone of all trading strategies here at TradingMarkets.
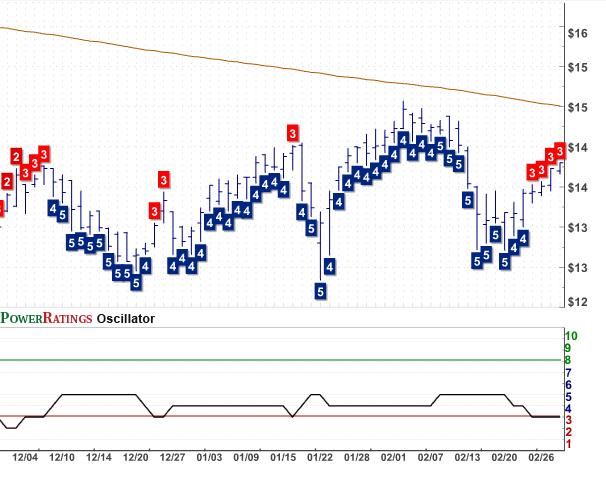
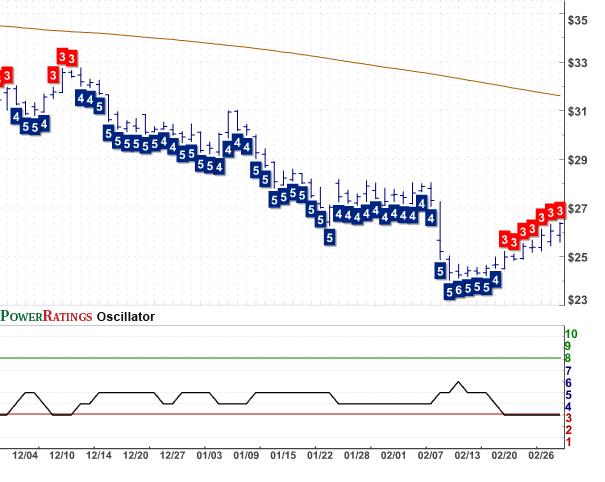
Below is a list of six stocks, all of which have made consecutive higher highs for five or more days. I have listed the stocks by PowerRating first (higher to lower) and by 2-period Relative Strength Index (RSI) values second. Selected PowerRating charts are also included to give traders a sense of the PowerRatings trend in the stock.
iShares MSCI Switzerland Index Fund ETF
(
EWL |
Quote |
Chart |
News |
PowerRating). PowerRating 3. RSI(2) 99.51.
Calamos Convertible and High Income Fund
(
CHY |
Quote |
Chart |
News |
PowerRating). PowerRating 3. RSI(2) 99.13. (See chart below)
Lifepoint Hospitals
(
LPNT |
Quote |
Chart |
News |
PowerRating). PowerRating 3. RSI(2) 98.56. (See chart below)
Tenaris SA ADS
(
TS |
Quote |
Chart |
News |
PowerRating). PowerRating 2. RSI(2) 99.90. (See chart below)
Telus Corporation
(
TU |
Quote |
Chart |
News |
PowerRating). PowerRating 2. RSI(2) 99.62.
Linn Energy
(
LINE |
Quote |
Chart |
News |
PowerRating). PowerRating 2. RSI(2) 98.05.
David Penn is Senior Editor at TradingMarkets.com.