Honey Money
While this market “resolves”
itself (maybe “relieves” is a better word), on the daily and weekly charts,
there are nice shorter term opportunities that continue to develop. Today we
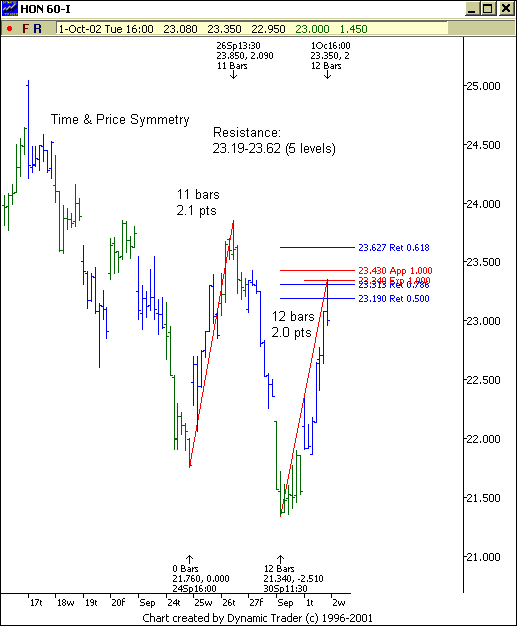
had an excellent example on the 60 minute chart of Honeywell (HON) that I shared
in TradersWire. Let’s bullet-point this:
1) Yesterday (HON) closed
into a key Fibonacci price resistance zone from 23.19-23.62.
2) This rally was at 2.0
points and 12 bars. That was almost identical to the previous rally at 11 bars
2.1 points. So, chalk this up to a time AND price symmetry decision against
our price resistance zone.

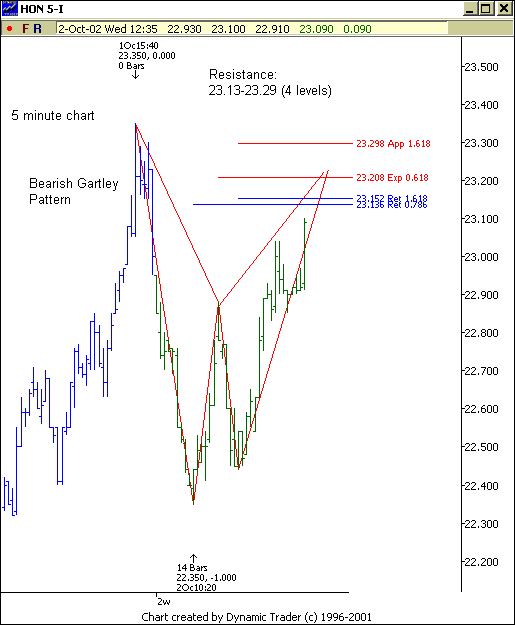
3) Because the market was
so strong on Tuesday, I was waiting for a trigger to enter a possible short
trade against this resistance zone. So, I drilled down to a 5 minute chart of
(
HON |
Quote |
Chart |
News |
PowerRating) below.
4) Early in trading today
(HON) the stock started out weak, but no trigger.
5) Later in the day (as
you can see from the chart below) we were given a bearish Gartley pattern against
a Fibonacci price resistance zone.
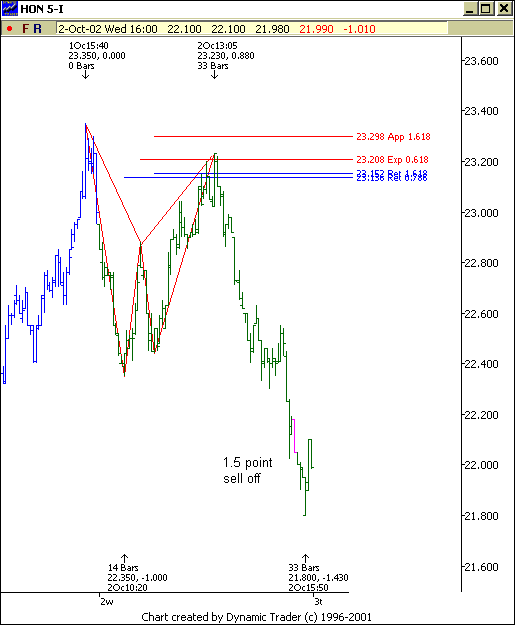
6) So, with the higher time
frame 60 minute chart resistance, time and price symmetry of the last two countertrend
rallies on the 60 minute chart, and this pattern on lower time frames. I got
my trigger to get short.

7) The rest of the day (HON)
provides a very nice short ride.

So you can blame this sell
off on the 4 billion dollar sell order of SPY at the end of the day…oops that
was supposed to be 4 million dollars(no no Bear Stearns). But, I’ll chalk it
up to a nice Fibonacci trade.
Â
Â
Good night!
Â
Â
Â
Â
Â
