How high can Crude Oil go? This chart can tell you
Now that the Crude Oil price has broken out above its
range of the year, how high could prices possibly go? One way to calculate a
price objective for securities is to measure the range that the security traded
in previously, and then project that distance forward from the top of the
previous resistance. In the case of the continuous crude contract ($WTIC), the
bottom of the previous range in 2006 was at approximately $59.00 and the top was
approximately $69.00.
The $10.00 difference is then added to $69.00 to obtain a new price objective of
$79.00. Once (or if) crude oil prices break above $79.00, a new price objective
can be calculated. The contract closed yesterday at approximately $73.33. Is it
O.K. to buy (the commodity directly or oil related shares) now or should
investors wait for a pullback? To answer this question, it would helpful to know
a downside objective in addition to the upside objective of $79.00 that was
previously calculated.
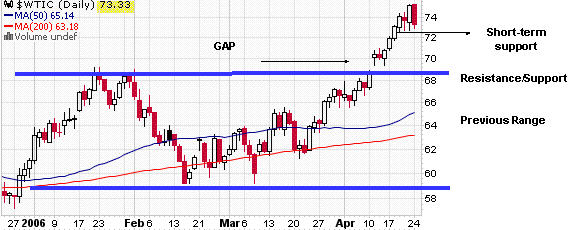
An impressive point about this chart is the fact that the break above the prior
resistance formed a rising window (or gap). This defines the range even more
definitively and likely establishes a new range for the commodity. The gap
should serve as support on any decline and also the previous resistance at
$69.00 should now serve as new support.
Therefore, you could feasibly use any drop below $69.00 on the close as a stop
point. In order to calculate a real risk reward, you take the price objective of
$79.00 and subtract the current price of $73.33. We have a possible reward of
$5.67. Conversely, we have a possible risk of $4.33 ($73.33-$69.00). The reward
is greater than the risk, but by only a margin of 1.3 ($5.67/$4.33). Going long
a security with a risk reward ratio of 1.3 is not viewed (by me) as highly
aggressive.
However, because some of the other tools that can be used to help determine
overbought/oversold levels are at the top of their ranges, I would prefer to
wait for a little bit of a pullback here. Please notice that since the 19th, the
lows of the contract have not gone below approximately $72.65. This could also
serve as another piece of support and is likely a good buy in point as well. Put
your orders in at slight pullbacks (but not deep retrenchments).
Sara Conway is a
registered representative at a well-known national firm. Her duties
involve managing money for affluent individuals on a discretionary basis.
Currently, she manages about $150 million using various tools of technical
analysis. Mrs. Conway is pursuing her Chartered Market Technician (CMT)
designation and is in the final leg of that pursuit. She uses the Point and
Figure Method as the basis for most of her investment and trading decisions, and
invests based on mostly intermediate and long-term trends. Mrs. Conway
graduated magna cum laude from East Carolina University with a BSBA in finance.