How I Apply Connors’ RSI(2) to Trading Pullbacks
As I mentioned in Part I of this series (Trading Pullbacks in Wall Street’s Best Stocks, July 21, 2009). There are two approaches commonly used in trading: trading stocks breaking out (championed by IBD among others) and trading stocks pulling back (championed by L. Connors among others). I’m particularly interested in how these approaches apply to trading fundamentally sound stocks, especially those with value left in their price. Here, I’ll describe a strategy aimed at trading pullbacks.
If you are looking to trade one of the most powerful pullbacks strategies available to traders today, order our newly updated guidebook –The Long Pullbacks Strategy – by by clicking here today.
Thirty-two stocks were chosen to demonstrate a strategy that triggers an end-of-day buy when its RSI(2) falls below a trigger value (2.5, 5.0, 10 or 20) and an end of day sell when its RSI(2) closes above 70. All trades were executed between January first and September 25th of this year. These 32 were fundamentally sound stocks, as determined by a series of fundamental screens, had value remaining in their price, as indicated by their respective PEG ratios. Each had been a TSM pick over the past quarter.
As an example, consider Trade 2 (Chart I) which required RSI(2) to close below 5.0 before one entered long near the close. The position would then be closed at the end of day when RSI(2) exceeded 70. Note, both trade decisions would be made in the last five minutes of each trading session. Utilizing this strategy, these 32 stocks would have generated 138 trades (79.0% winners) and an average profit of 70 cents per share traded (the best win percentage of the four strategies, though Strategy 1 had a better average trade profit). Note, the red boxes highlight those stocks that generated overall losses. The following profit/loss results (+$73,950) could have been generated from Strategy 2 making 150 trades of 1,000 shares each.
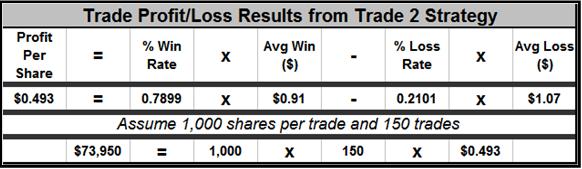

While each of these four strategies provided very good trade entry and exit points for these quality stocks, I prefer the combination win rate to number of trades offered by the second strategy because of the number of trades. Note too, the last row which shows that over this same time period, SPY (ETF for S&P 500), generated losses with all four strategies.
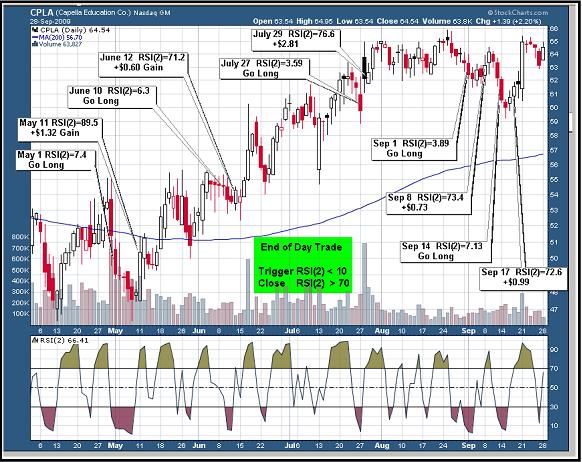
The following six-month price chart for CPLA shows where five of the strategy 3 trades occurred. Though all were profitable, an exit that allowed one to stay a few days later in the trade would have produced better returns. Requiring the stock to be above its 200-day moving average would probably have eliminated riskier trades.
Finally, consider how buying and selling pressure varies for a quality stock that has value. Once identified, everyone wants to own it (that’s you and me as well as institutions) so buying pressure builds driving its price higher, finally to a point where it becomes extremely overbought: investors stop buying; traders sell their positions and short sellers step in sensing the overbought state. Selling pressure temporarily wins out, and price falls. The pullback begins, but all the while, institutions, investors and traders look for a reentry point: at the support of a major moving average (20-, 50- or 200-day), at a prior price reversal (earlier valley or hill) or at a major Fibonacci level (38.2, 50 or 61.8%). Though my work using pattern recognition surveys has shown there’s something symmetrically pleasing about the Fib levels that causes people to react there, these areas of support are not magical, just self-fulfilling because smart money reacts there. Trading (or investing in) quality stocks in pullback presents a low-risk, high-profit opportunity for the individual as well as the institutions.
Richard Miller, Ph.D. – Statistics Professional, is the president of TripleScreenMethod.com and PensacolaProcessOptimizaton.com .