How I Focus On Where The Best Opportunities Are
What Thursday’s Action Tells
You
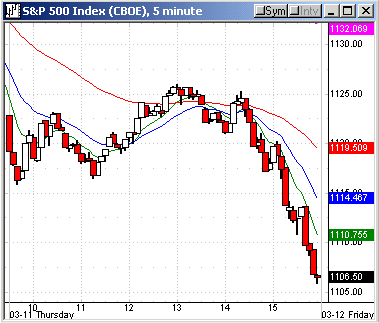
Yesterday’s market action resulted in an
excellent day for traders. NYSE volume was 1.89 billion, as the SPX
declined -1.5% to the 1106.79 close. Once again, there was
about
a 10 point knife down in the last hour after a range of 10 points from 9:30
a.m.
to 3:00 p.m. ET. There was a definite program agenda in the decline, as
bonds
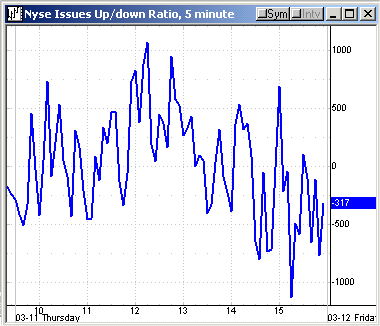
rose in sync with the SPX knife down. The volume ratio was 14 with 1.61
billion
shares on the sell side and a 4 MA of just 18, which I haven’t seen in quite
a
while. Breadth was -1572, with the 4 MA at -1123, so that is in line with
the
volume ratio 4 MA.
The Dow ended at 10,128, -1.6%.
The
five-day RSI for the SPX is 12 and for the Dow, 6, as both indices are -4.4%
over the last four days. The Nasdaq and QQQ, which
have
led to the downside since 01/26 and 01/10 and are certainly more oversold,
were
-1.0% and -0.8% yesterday.
The primary sectors were all red, and over
the
past four days, the SMH has declined -7.2%, the XBD -6.4% and the CYC
-6.1%. The XBD is declining from a very overbought condition where price was
+21% above its 40-week EMA, while the XLB (basics) was +13.1% above its
40-week
EMA.
| Friday 3/5 |
Monday 3/8 |
Tuesday 3/9 |
Wednesday 3/10 |
Thursday 3/11 |
|
Index |
|||||
SPX |
|||||
High |
1163.23 | 1156.86 | 1147.32 | 1141.45 | 1125.96 |
Low |
1148.71 | 1146.97 | 1136.84 | 1122.62 | 1105.87 |
Close |
1156.86 | 1147.20 | 1140.57 | 1123.91 | 1106.79 |
% |
+0.2 | -0.8 | -0.6 | -1.5 | -1.5 |
Range |
14.5 | 9.9 | 10.5 | 18.6 | 20.1 |
% Range |
56 | 2 | 35 | 7 | 5 |
INDU |
10596 | 10529 | 10457 | 10297 | 10128 |
% |
+.07 | -0.6 | -0.7 | -1.5 | -1.6 |
Nasdaq |
2048 | 2009 | 1995 | 1964 | 1944 |
% |
-0.4 | -1.9 | -0.7 | -1.6 | -1.0 |
QQQ |
36.65 | 35.76 | 35.65 | 35.17 | 34.88 |
% |
-0.3 | -2.4 | -0.3 | -1.4 | -0.8 |
NYSE |
|||||
T. VOL |
1.37 | 1.25 | 1.48 | 1.65 | 1.89 |
U. VOL |
819 | 372 | 261 | 197 | 254 |
D. VOL |
538 | 866 | 1.20 | 1.44 | 1.61 |
VR |
60 | 28 | 18 | 12 | 14 |
4 MA |
52 | 50 | 42 | 29 | 18 |
5 RSI |
69 | 43 | 32 | 17 | 12 |
ADV |
2236 | 1394 | 1237 | 845 | 898 |
DEC |
1075 | 1906 | 2070 | 2472 | 2420 |
A-D |
+1161 | -512 | -833 | -1627 | -1572 |
4 MA |
+371 | +347 | +154 | -453 | -1136 |
SECTORS |
|||||
SMH |
-0.9 | -4.1 | +0.6 | -2.0 | -0.8 |
BKX |
+1.0 | -0.4 | -0.6 | -1.4 | -1.5 |
XBD |
+0.6 | -1.6 | -1.6 | -2.2 | -1.6 |
RTH |
-.03 | -0.6 | -0.8 | -2.1 | -0.9 |
CYC |
+0.1 | -1.3 | -1.2 | -2.7 | -1.0 |
PPH |
+0.2 | -0.2 | -1.3 | -2.2 | -2.2 |
OIH |
-0.6 | +0.2 | -1.7 | -3.3 | -1.8 |
BBH |
+1.6 | -1.5 | -1.1 | -1.8 | -1.3 |
TLT |
+1.9 | +0.6 | +0.6 | -.06 | +0.1 |
XAU |
+2.9 | -1.1 | +0.1 | -3.2 | +1.2 |
^next^
For Active
Traders
The major indices and SMH started the day
down at
the extended three-month 95% band, and then we got the down opening,
although
not as big as hoped for, as the future sellers disappeared really early. The
lambs were fleeced in the first 15 minutes of emotional selling. There was a
Trap Door contra move that went trend up from the SPX entry level above
1117.67.
The initial low was 1115.85, with the 1.0 volatility band at 1114. This
entry
ran to an intraday high of 1126 by 1:00 p.m. Before that move into the 1:00
p.m.
high, there was a retracement to the 1115.85 9:40 a.m. low, which set up a
1,2,3
higher bottom entry above 1118.25, if you had missed the first contra move,
which had only traded back up to 1123.13 before the 1,2,3 higher bottom
setup.
The afternoon trade setup was a no-brainer
with a
1,2,3 lower top short setup with entry on the 2:35 p.m. bar below 1121,
which
put price below all of its 20, 60 and 240 EMAs. Bonds started to rally as
the
trend entry was taken. You had seen what happened the previous day, so this
was
a trade you had to probe. It turns out, as luck would have it, the result
was a
moonshot down to the 1106.79 close.
Whether you took the initial long or the
afternoon 1,2,3 lower top short, you won. And if you took both,
congrats.
The SMH had a 38.77 low on the first bar,
then
reversed the previous day’s 38.80 low and the 39 2.0 standard deviation
band, in
addition to the .236 retracement from 45.78 to the 17.32 October 2000 low,
which
is 39.06. The confluence just below that is 38.44, 38.29 and 38. This was,
and
is, an action zone where you take reversal setups when you get them.
The initial contra move went to 39.50, then
retraced to 38.86, setting up a 1,2,3 higher bottom with entry above 39
again.
That ran to 39.86 before the afternoon delight down to a 38.73 close. You
had to
get some part of those two initial entries.
The QQQ was probably the easiest read and
trade
to manage because it was also a good confluence zone. The .38 retracement to
the
23.32 March 2003 low was 34.55. The .236 retracement to the 19.76 October
2002
low was 34.46 with the 34.15 200-day EMA just below that. The QQQs hit a
34.98
low on the opening bar after a 35.07 opening, down from the previous 35.19
close. Not much of a discount. This quarter put in an opening only buy order
at
the 1.0 volatility band level of 34.75, but there were plenty of buyers to
offset the early selling. You know that because it was a spike volume bar of
six
million shares that closed in the top 25% of its range at 35.12.
After the initial bar, it became a Flip Top
setup
because the next three bars’ entire range was inside that opening bar. Entry
was
above 35.15, and price advanced to 35.48. It retraced to 35.08 and a 1,2,3
higher bottom entry above 35.16, which was the second chance if you missed
the
Flip Top entry. This move went to 35.53, then declined to a 34.88 close,
along
with the rest of the market.
Today’s
Action
All of the three-month extended bands for the
major indices are in play again today after yesterday afternoon’s knife down
into the close. The QQQs are at the 2.0 band, which closed at about 34.75 –
35
yesterday, with the 3.0 band down at 34, along with the other confluence
from
yesterday’s commentary, which is the 200-day EMA at 34.15, 40-week EMA at
34.26,
.236 retracement at 34.46, .382 retracement at 34.55.
The SMH closed at 38.76, with a zone of
numbers
at 38.44, 38.29, 38.19, which is the 40-week EMA, and 38, which is the
200-day
EMA. The 2.0 three-month band is between 38.40 and 38.50, and for any
washout,
the 3.0 band is below at 36.75 – 37.
The SPY closed just below its 2.0 band, with
the
3.0 band at 108.50 – 109 level in case there’s an air pocket.
I’ve done this with all 19 components of my
composite and also the largest percentage weighted stocks in the HOLDRs. It
makes you focus on where the best opportunities are, and you can just
concentrate on the price action and zone to identify good setups.
The QQQs, SMH and XLK remain my primary focus
for
both daytrading and position trading because of zone location, but that
doesn’t
mean not to take any futures or proxy setups in the S&P 500 and Dow,
should they
setup.
Have a good trading day,
Kevin Haggerty


