How I Identify The Most Powerful Intraday Pullbacks
“Give a man a
fish; he will be hungry tomorrow. Teach a man to fish; he can sustain himself
for a lifetime.”
I am not sure
if I have the exact quotation, and unfortunately do not even know to
whom to credit this valuable statement, nonetheless, it is powerful and true.
Naturally, a tool is only as good as are the directions on how to use it.
Without directions, most likely the tool will be of very little use.
The same can be said for the Floyd Numbers
(FNs). Once you know how to use them, they
seem incredibly simple to use (and they are), but at first glance, they can seem
a bit overwhelming. “Why are there so many?” or “How do I implement them?” etc.,
are very common questions.
Before I go any further, let me state
clearly that my entire discussion of FNs is completely applicable to the
Key Technical Numbers that are in
my column each morning. So if you are a reader of my daily column, consider
this an in-depth lesson on how to use the KTNs.
If use
my daytrading service, then of course, you will find the following insights
of great value.
Let’s use the example of the 200-day
moving average, as it relates to investing or longer-term swing trading. Most
traders/investors understand the significance and importance of the 200-day
moving average. They view it as either support or resistance, depending on which
way the current price is approaching it from. The chart below shows the 200-day
average acting as POTENTIAL support. I stress
“potential” simply because, like most indicators, it is not absolute. You need
to factor in several other factors, some of which may include:
1. Is the stock overbought or oversold
based on your favorite oscillator, like a MACD or Stochastic?
2. Which was is the general market trending?
3. How is the sector in which the stock trades doing?
4. Does the 200-day average correspond with a Fibonacci level?
5. Is it the end of a fourth Elliott Wave?
The point is, IF
there are other valid reasons for the trade which you already use to determine
entry points, and now you have this extra piece of information, you now have
several valid reasons to initiate the trade.
In the case below,
The Japan Fund
(
JOF |
Quote |
Chart |
News |
PowerRating), at
Point A you have the price coming down to the
200-day moving average, while simultaneously you had the stochastics in an
oversold condition. Point B offers the same setup,
however this time not only are the stochastics oversold but now you have a
stochastic divergence. This entry, due to that little extra “edge,” produced a
much more powerful move to the upside.
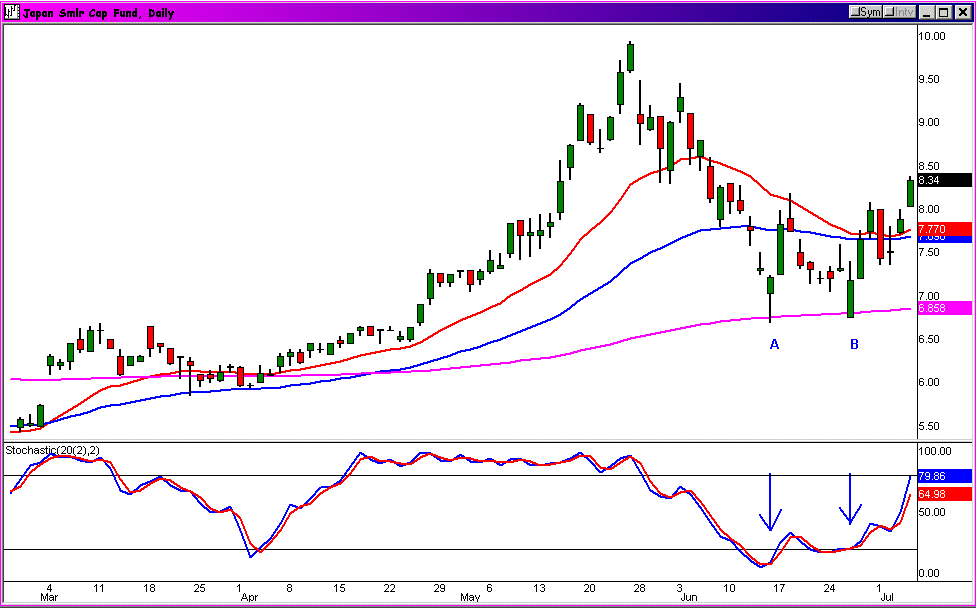
So, while I suspect that for most
people this was a pretty straightforward example, it illustrates how effective
support and resistance levels are when they coincide with your typical approach
for trade selection. Given that I rely on stochastics
on daily charts, I was already contemplating an entry regardless of the 200-day
moving average. This new information just made the trade even more
appealing. The result was not only a successful trade, but I increased my share
size in order to take advantage of what I considered to be a higher probability
trade.
Now, if that logic works on longer
term trades, wouldn’t it be safe to assume that it would apply to any time frame
provided you had a successful approach/strategy to begin with? Absolutely. One
of the things that I have been fortunate enough to have done is that I started
my trading career by trading the most minute, hyper sensitive time-frame
possible. Many of the strategies and tactics I use looking at 1- and 5-minute
charts apply to longer term trades as well. That being said, in order to use the
FNs successfully, you already need to have
in place an approach that works. It does not matter what it is, tape reading,
moving average crossovers, Elliott Wave, Fibonacci or a combination thereof.
For now, let’s forget about
FNs, and take a look at my approach to
trading intraday. My sole focus is the one-minute chart, and to some extent the
5-minute chart. My primary indicator is the S&P 500 & Nasdaq 100 futures, which
I then use to base my decision on when to enter a trade on the underlying stock.
The stocks I normally trade are IBM, Citigroup, Tyco, Ebay and Mercury
Interactive. These stocks are highly correlated with the S&P futures, so they
make an excellent proxy.
My strategy is straightforward:
1. Trade in the direction of the trend
(based on 1-minute chart)
2. Buy pull-backs in up-trends
3. Sell-short rallies in down-trends
My goal here is not to show you how I
trade, but how I factor the FNs into my
existing game plan. The chart below is a textbook case of buying pullbacks using
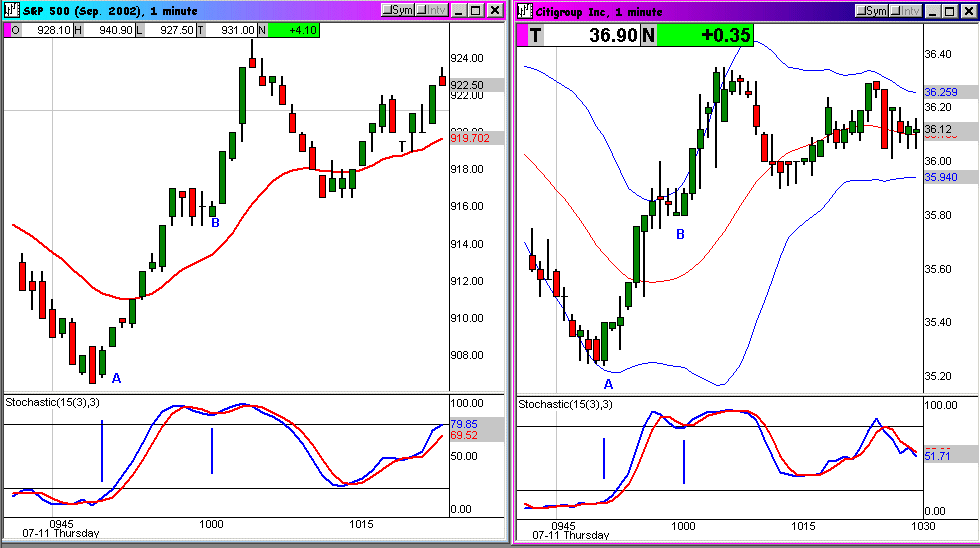
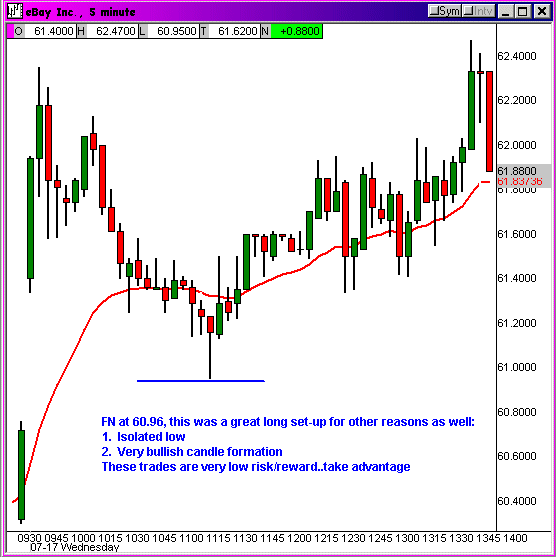
the S&P 500 as my lead indicator.
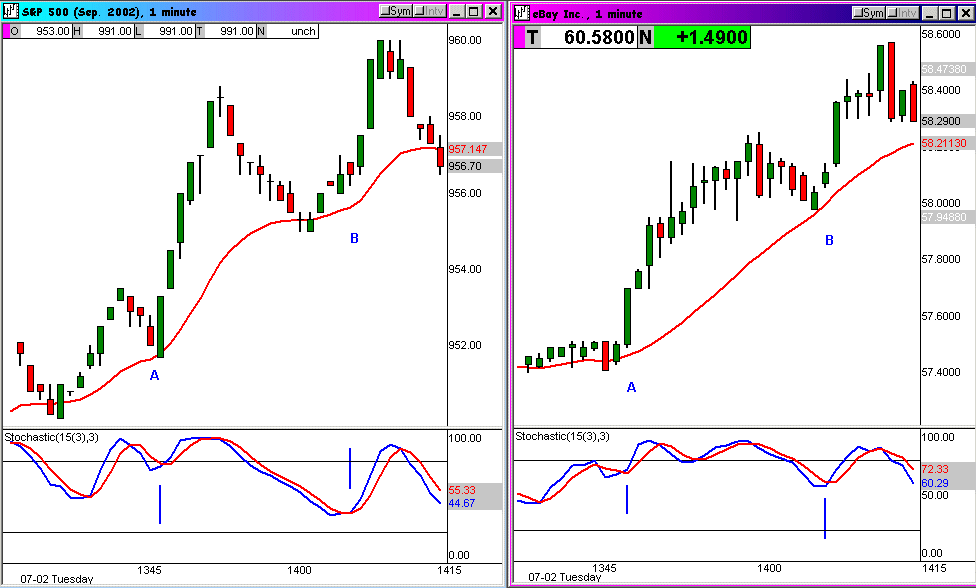
Notice the very slight lag time
between when the S&Ps initiate their upward thrust and the time it takes EBAY to
react. It is only a fraction of seconds, but it is enough time. The resulting
moves for both A and B were very nice trades indeed. Based on these two setups
alone, I would have traded my usual share size on a per trade basis. However,
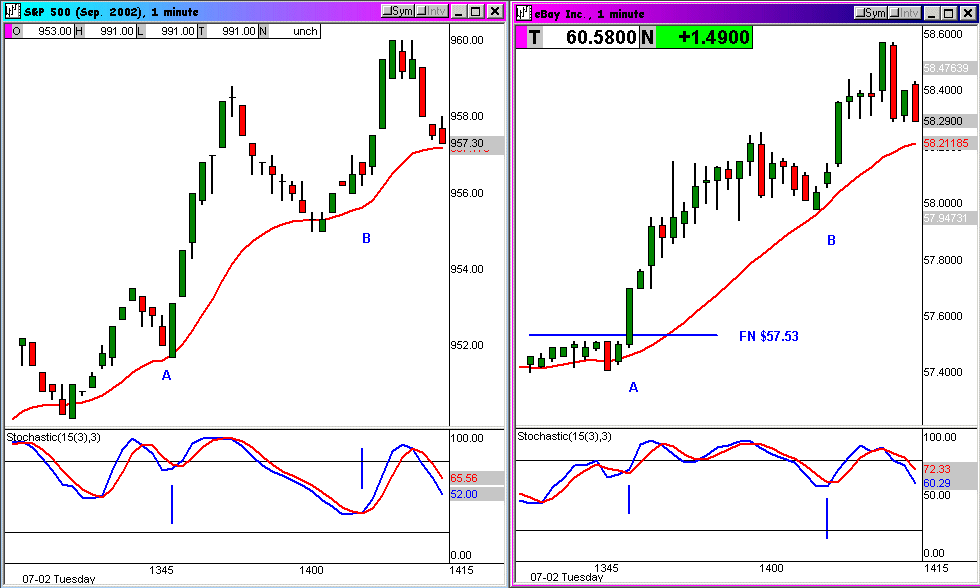
what if I were to add one more piece to the picture? In this case a
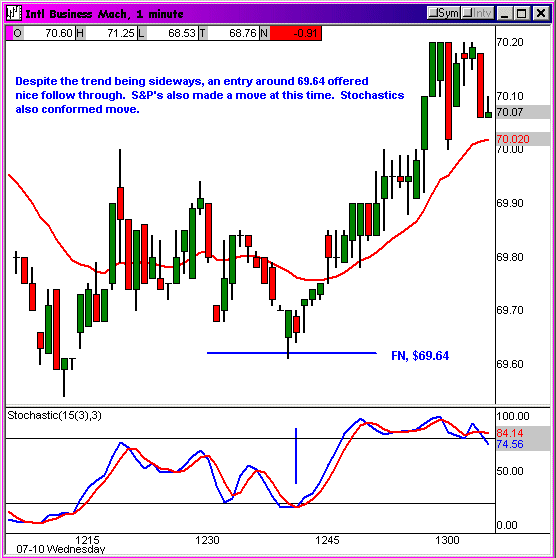
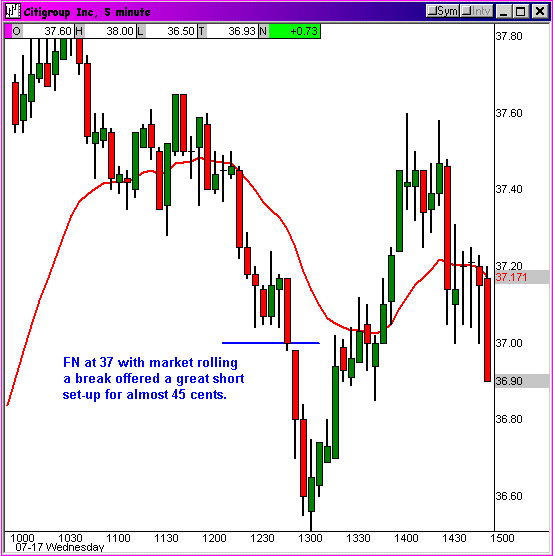
FN on EBAY of $57.53.
If you were to go back in time on this
chart of EBAY for just 10 minutes, you would see that it could not get above
this level. Naturally, it is reasonable to assume it would breakout pretty well
if you had a move above that level which coincided with a move up in the
futures. That is exactly what happened in this case.
Your question may be: “So what, you
would have taken the trade anyways simply because it met your definition of a
pullback buy in an up-trend?” True, and this is where the FNs will give you an
additional edge, knowing this allowed me to feel very confident about the trade,
and as a result, increase my share size to take advantage.
Point A represented an above-average opportunity.
Let’s address the question that I get
frequently:
“How
do I incorporate the FN’s into my daily trading regimen?”
The
way the FNs are
formatted each night shows you a 5-minute chart of the previous day’s action
with the projected support and resistance levels drawn on the right hand side.
Naturally, this is just a presentation, the best way to use them is to actually
draw in the numbers in the form of a horizontal line on your 5-minute chart.
The chart below
shows how this can be done:
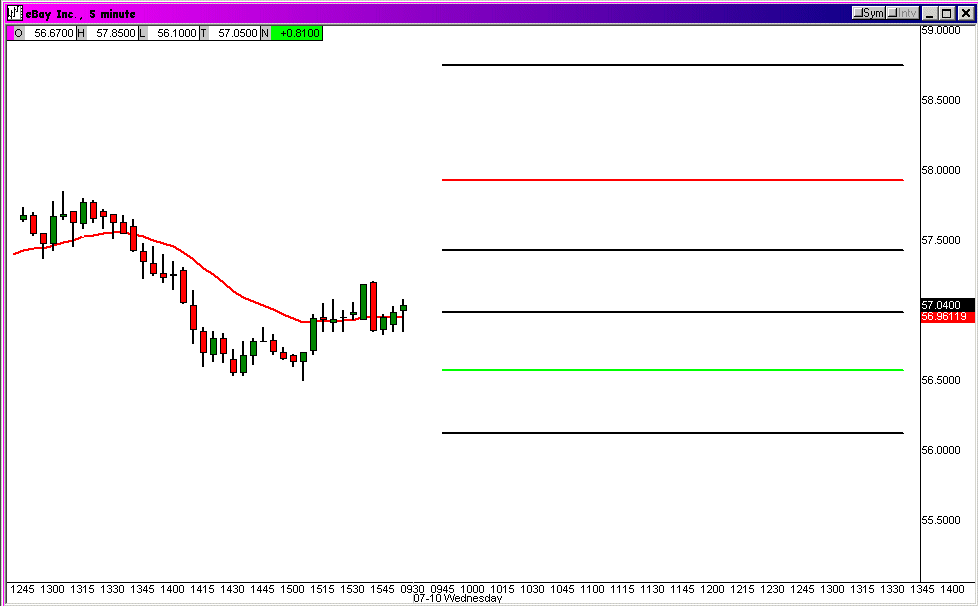
Once that
is complete, you now have the support and resistance areas right in front of you
while trading, making it very obvious where potential reversal points may be.
Now, let’s take a look at some recent examples of
FNs in action. Seeing examples over and over
again will reinforce the effectiveness of using FNs in your trading.
Additionally, I will post perhaps two to three times a week examples on the
FN Message Board
of how I used them in my own trading. Each image of the
trade/chart will also be accompanied by commentary. The message board is also an
excellent way to interact with me, my trading partner Todd Gordon (link to his
email address, todd@aspentrading.com)
and other FN subscribers.
Notice
how the entry point also coincided with a Stochastic oversold condition. Again,
a valid setup in and of itself, but with the FN, an even better setup.
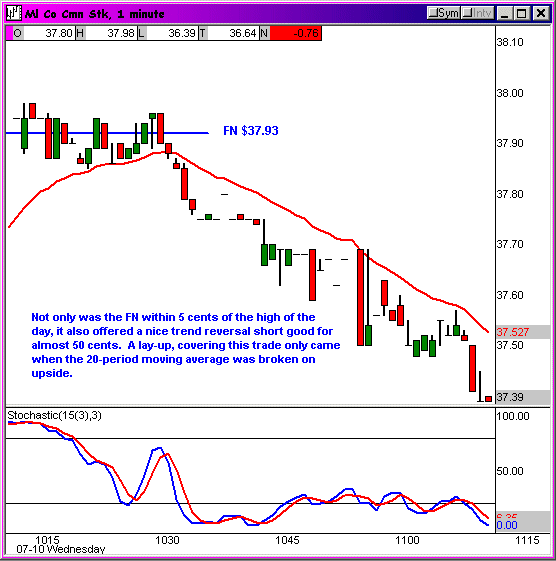

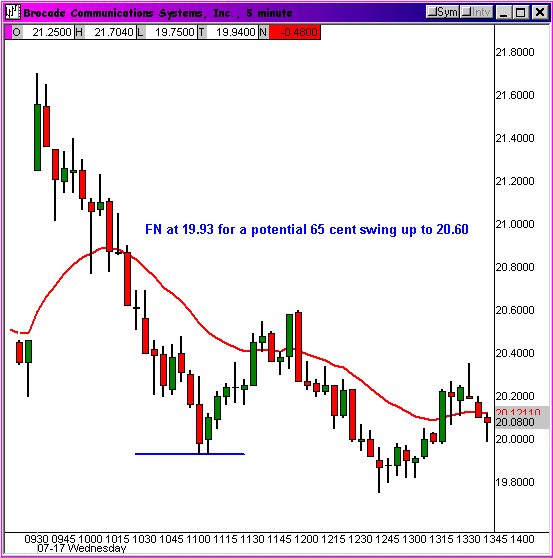
Normally I would not take a long trade when the trend is clearly down, as noted
by the downward slope on
(
BRCD |
Quote |
Chart |
News |
PowerRating) above. However, knowing that you are coming
down to an FN
with a stochastic oversold (not shown), I will actually nibble at this setup,
perhaps only half my normal share size vs. not taking the trade at all. At least
now I am in the game, with a decent risk/reward ratio.
I have
thrown a lot of information and examples at you in this tutorial, so please feel
free to contact me if you have any questions. My goal is to make you a more
effective, profitable trader by using the FNs.