How I rode gold from 432 to 500
While it’s difficult for most
of us to say what our best trades are, I am going to focus on a trade which took
place in September of last year producing a technical setup that coincided with
a great deal of volatility generated from Hurricane Katrina. I had been
championing the cause for gold and as a result of Katrina, the metal had
undergone a correction. This correction was in response to a very strong impulse
move up. Those who have read my book or read my blogs are aware that I like
buying weakness in rising markets, selling strength in falling markets, and
taking profits at predetermined price points. With gold making a defined
pullback after a nice impulse move up, the potential to catch a flier back to
the upside was very strong.
This is all great in theory,
but no trade is ever a guarantee, so properly working my way into this position
would be paramount in giving myself every chance to realize the potential behind
it. As a rule, I like phasing into positions, as I will discuss in more detail
in “My Favorite Strategy†– with this trade being no different. Much of what
gold can do often times happens in the overnight market.
I had been calling for a move
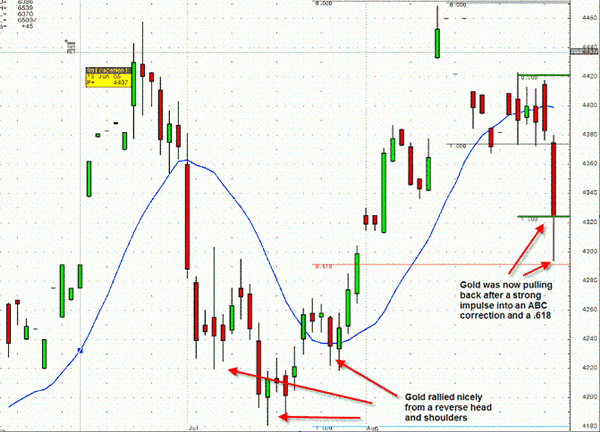
in gold up to $500 an ounce by year’s end, and with a pullback to 430-434, a
low-risk, high-reward opportunity had fallen in my lap. My first position as you
can see from chart one came at 432 ish, which was the 1 x 1, or ABC move down. I
hit that for ¼ of the position. I hit the next ¼ at 430 as that was the area,
which was a .618 retracement from the entire move up as well as having been a
pivot back in early and late July. It also matched up with a key breakout point.
I was now in half and that allowed me some pucker factor if the position went
against me. This was one of those trades that since it could really move fast,
having some overnight exposure was essential. The next entry for the other half
would come after it put in a reversal bar, i.e. closed in the upper half of its
daily range, or took out previous day’s high, whichever came first. From there,
I move my stop below the pivot low at 430 and pray.

The next day gold put in the
reversal bar I was looking for and could not follow through to the downside,
thereby triggering the other half around 435-436. The next day gold launched and
I really played this for the larger macro move.

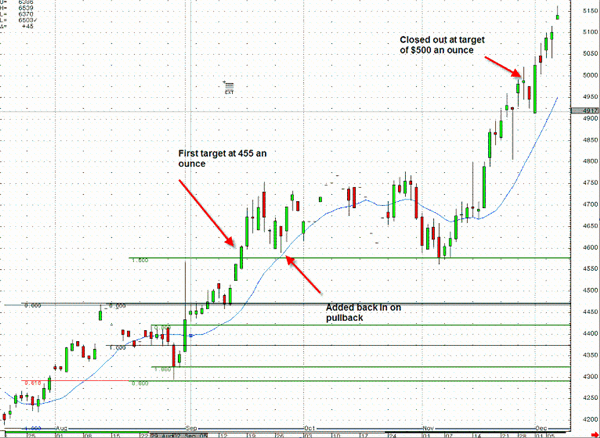
My first target was at $456,
since that was a 1 x 1 from the previous move, that would give me $20 an ounce,
which isn’t much of a move at all for gold today, just 12 months removed, but
back then it was a nice place to book half the profits. I then was a little more
liberal with the rest as I used the 15 simple MA to help me work the position.
On Sep 27, 2005, gold pulled back to its 15 MA on the daily chart, and using the
profits from the previous move, I got back into the position from before plus
half a position more, entering at 460 an ounce and getting an immediate pop. I
traded around it and skimmed a quick $6-8 an ounce and kept working the
position. The following two weeks saw gold chop and I skimmed my size down to ¼
again with my stop all the way back at break even down at 432 with a target of
$500 an ounce. It took some patience and a roll over of my position, but in late
November, gold hit $500. I rang the register nicely and actually got out a
little early of that trade as gold continued to move up to 530 before pulling
back. I have been in and out a lot since, but that trade is what One Shot — One
Kill Trading is about. Finding trending markets that provide low-risk,
high-reward setups and executing on them with the confidence to understand you
are giving yourself a great chance for success.
John Netto
