How I Short Term Traded AAPL These Past Few Months
In past months, I’ve detailed approaches to trading intraday, introducing something I called trading “wiggles” from CCI and RSI triggers (Intraday Trading High-Quality Stocks, Part 2 (6/16/09)). I combined this approach with option strategies where the goal was to deploy cash at 20% plus annual rates of return (Intraday Trading High-Quality Stocks, Part 1 (6/5/09)). Here, I describe an approach that profits from trading intraday patterns: more specifically the first hour’s trading behavior of ^AAPL^ shares.
Always, I concentrate on trading long, fundamentally sound stocks because of their inherent institutional support. AAPL has survived several fundamental screens over the past two months. For example, it was a member of eight of 15 fundamentals-driven screens (IBD, Vector Vest, Navellier and Zacks) this week. Further, even closing above $200 its PEG ratios at 0.88 and 0.98 over the next two years show that AAPL still has substantial price growth available, as well as a large institutional following. AAPL is an ideal candidate for trading intraday: good fundamentals, a good institutional safety net, price growth potential and four of the last five years it’s experienced price growth from 10/31 to 12/31 (-20.7% 2008, +4.3% 2007, +4.6% 2006, +24.8% 2005 and +22.9% 2004).
I reported earlier that one uncovers consistent tradable patterns by studying a few, high volume, fundamentally sound stocks. For example, over a 61 trading day period between 3/05/08 to 5/30/08, AGU made either its high or low of the day, in the first hour of trading, 85 percent of the time. That’s a pattern that can be traded simply by watching the first hour then placing a buy stop-limit order just above the first hour’s high. When the first hour’s trading defines the low of the day, the strategy is profitable, and of course, when it defines the high of the day, no trade is made. More recent AAPL trading patterns suggest similar treatment.
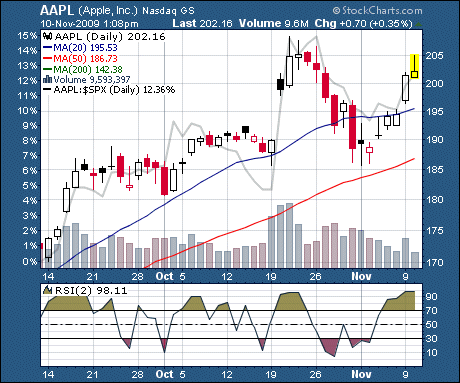
Over 42 trading days between 9/11/09 and 11/10/09, AAPL made either its low or high of the day in the first hour of trading 37 times (88.1 percent of the time). Five of these made both the high and low of the day in the first hour’s trading (22 lows, 20 highs and 5 both). AAPL’s daily chart over this period shows that it has trended higher generally, but at the same time, there have been periods of consolidation and significant pullback as well. RSI(2) showed both oversold and overbought periods, while its relative strength versus the S&P similarly showed times of over- and under-performance. This has clearly been a period where AAPL’s market response has varied.

Today, I’ll look at the performance of a strategy that simply buys AAPL’s open then sells its first hour’s close (Close – Open). I’ll then contrast that performance against the ideal strategy of buying the open but selling the first hour’s high (High – Open). Clearly, this latter is not something one can execute exactly, but it does show the profit opportunity there to be captured.
To explore these two strategies, I used a statistical technique called “Bootstrapping or Resampling.” I first assumed that the 42 data (first hour’s open, high and close) from actual performance provided a window into AAPL’s behavior given an environment where its fundamentals have been strong and its price growth potential still positive. I randomly resampled the 42 data (with replacement) five times to create a hypothetical week’s performance and then repeated this procedure 10,000 times to assess statistical properties like mean and cumulative performance frequencies. Note, resampling is like: (1) writing the performance data for each of the 42 days on a ping pong ball, (2) randomly pulling a single ball from a hat, (3) copying its performance and then (4) putting the ball back in the hat to possibly be pulled again. The approach produces many combinations of the original 42 data.
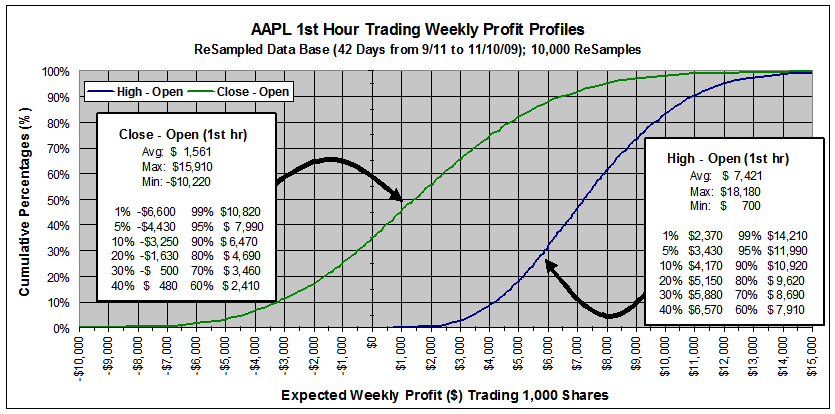
This next chart shows the average week’s performance as cumulative percentages for the two strategies: buy the open and sell the first hour’s close and buy the open and sell the first hour’s high. On average, buying 1,000 shares of AAPL at the open then selling the first hour’s close would be expected to produce a $1,561 gain weekly. One percent of the time (about once every two years), it could be expected to lose between $6,600 and $10,220 in a week, but with equally likelihood, also gain $10,820 to $15,910 in a week. Overall, the strategy would be expected to produce a gain about 67 percent of the time.

Contrast the above strategy to the potential profit that could be extracted from the first hour’s trading, i.e., from the High – Open data set. The average weekly return possible is $7,421, and one percent of the time it could be expected to return at the low end between $2,370 and $700 in a week and at the high end between $14,210 and $18,180. Clearly, our simple strategy of buying the open and sell the first hour’s close leaves most of the profit on the table. Profit targeting, stop-loss points, trailing stops, and including a market environment factor would all help to develop a strategy that could be expected to capture a larger percentage of the first hour’s profit potential.
In the week’s to come, I’ll explore other strategies to exploit the first hour’s trading, but obviously intraday patterns present opportunities.
Richard Miller, Ph.D. – Statistics Professional, is the president of TripleScreenMethod.com and PensacolaProcessOptimizaton.com.
