How I Stay Out Of Low-Probability Trades
I was having lunch the other day with one of the
principals of my clearing firm, Rich. He asked me how I can possibly
come up with something to write about each and every day. I told him that for
the most part there is usually something to talk about, although at times I am
simply at a loss. However, knowing that I need to put something together each
night forces me to be very observant as to what is and what is not working
intraday.Â
In recent months with the market undergoing subtle and not-so-subtle changes,
I have begun to pay closer attention to Bollinger Bands. I have used Bollinger
Bands for years, but usually only as a way to determine when a quick move is a
bit overdone and a good candidate for a reversal. However, in recent months I
have come to use Bollinger Bands as a way to keep me honest and out of
low-probability trades. As we all know, the recent market environment requires
near perfection. A couple of recent examples will illustrate:

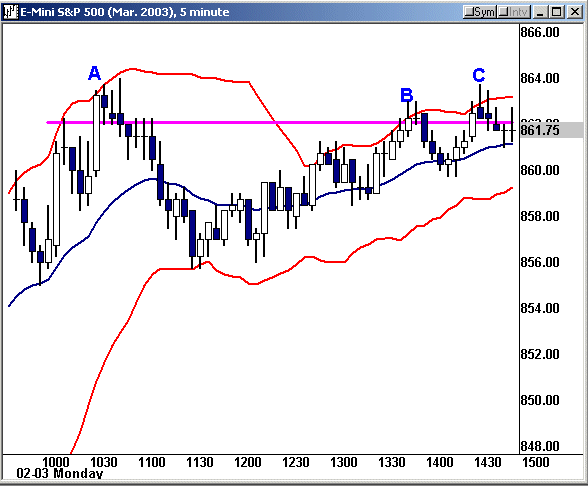
Notre a few items first. The horizontal PINK
line represents the key 862 level (50% of Oct/Dec high/low). A, B and C
represent areas that under some circumstances would allow for great long
entries. The market has pulled back to the 20-period EMA and appears to be
pushing toward/through the resistance area. In the past these levels would be
pierced easily. Now with a battle occurring at every level, watching the
Bollinger Bands for confirmation/non-confirmation is critical.

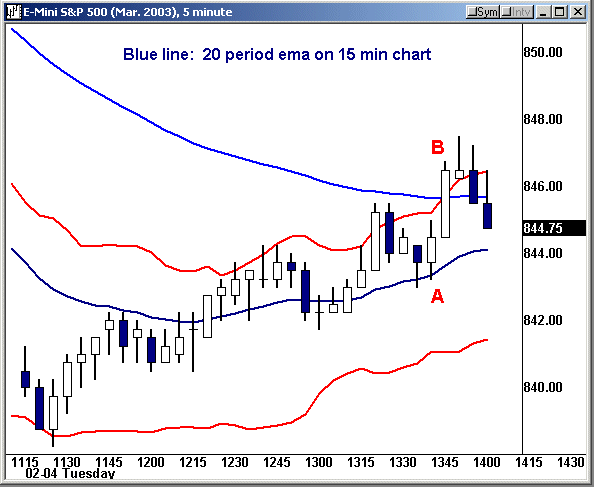
The second example is from yesterday afternoon. The S&Ps were approaching
their 15-minute MA, a very nice place to establish positions under the proper
circumstances. In this instance, unless you were really quick, the trade never
materialized. It shot through the 15-minute AND the top Bollinger Band (Point B)
only to come crashing right back in within 5-10 minutes. The better trade is to
catch these on pullbacks to support, anticipating the move back to the Bollinger
Band, while exiting into the buying spree.
I did not take any of these entries simply because over the last several
weeks and months I have to come to realize that rarely does a breach of either
of the bands result in any real move. The trick is to now anticipate a run to
these levels and pare out of most of the trade as the market approaches
it. Certainly a different approach than most of us are accustomed to.
The Bollinger Bands are now a part of my game plan each day for one simple
reason, they keep me out of low-probability trades. Staying clear of
low-probability trades in this market can only add a few percentage points to
your total return in this market.
The remainder of our lunch surrounded sports and naturally trading. At this
point, you have your game plan each and every day, nothing too complex, but a
plan nonetheless. However, each day seems to throw a new wrinkle. As I have said
many times in the past, all traders are adjusting to this new environment. Not
everyone has the same conviction and assertiveness now either. The result is a
labored grind with each trader seemingly waiting the action of the next trader.
Key Technical
Numbers (futures):
S&Ps |
Nasdaq |
| 886 | 996 |
| 874 | 987 |
| **862** | 983 |
| 852 | 974 |
| **842-45** | 966 |
| **837** | 957 |
| 830 | *941* |
| 819 | *932-33* |
As always, feel free to send me your comments and
questions.
