How I trade using multiple timeframes
Dave Floyd is a professional FX and stock trader based in Bend, OR and the
President of Aspen Trading Group. Dave’s approach to FX combines technical
and fundamental analysis that results in trades that fall into the swing
trading time frame of several hours to several days. For a free trial to
Dave Floyd’s Daily Forex Alerts
or call 888.484.8220 ext. 1.
Confluence on Three Time Frames Indicates Solid
Short Set-Up
One of the topics I will be addressing in an upcoming
segment of my ongoing FX Tutorials (read
part I and
part II here) is combining multiple
time frames looking for ‘confluence’ areas where the technical picture becomes
very clear.
The charts below
of CHF/JPY outline a very basic, yet effective, example of several resistance an
support areas coming together at the same time that may well result in a solid
short.
Key Points:
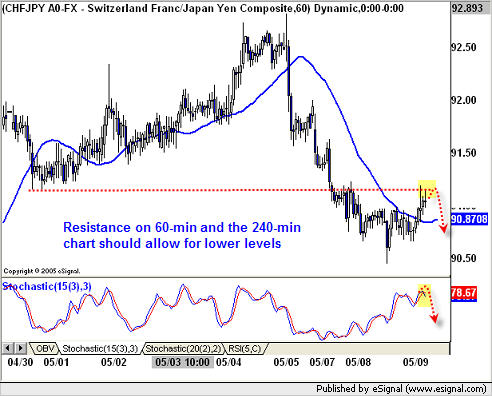
– the 60-min chart finds resistance at a low from
back on April 30th
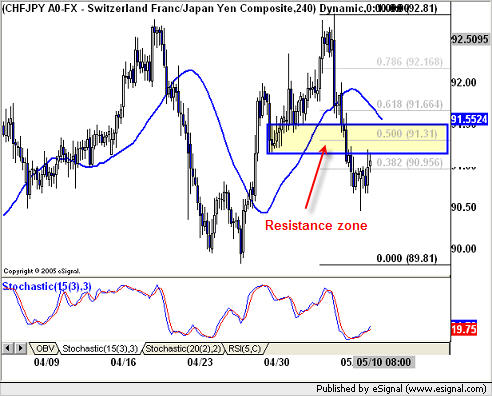
– the 240-min chart has fib resistance at roughly
the same area, 91.35
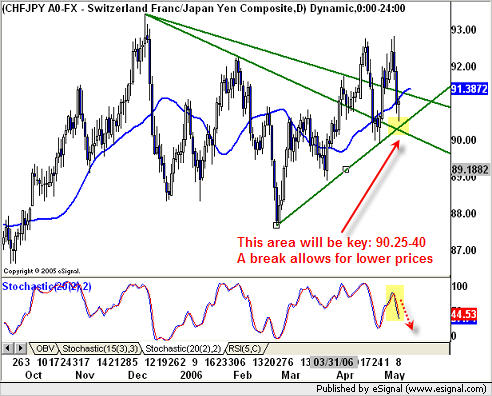
– the daily chart has failed at trend-line
resistance and is now set to push below bull trend-lines (yellow highlighted
area)
– momentum, as defined by the stochastics is
bearish, although the 240-min chart exhibits a bit of upside price pressure
As always, feel free to send me your
comments and questions.
Aspen Trading Group