How I Use Momentum In Forex Trading
The Momentum Box
Often times there is a pattern in our current trending markets whereby the pairs consolidate for quite a period of time after a series of impulsive/trending moves. When this happens, as the markets get bottled up between a floor and a ceiling, you often see what I refer to as the ‘Momentum Box’.
This is where the 12-period Momentum indicator gets boxed up as well between a floor and a ceiling. This setup becomes an opportune time to help us forecast when a legitimate breakout is occurring, how to trade it, and when to exit the position.
Click here to learn how to utilize Bollinger Bands with a quantified, structured approach to increase your trading edges and secure greater gains with Trading with Bollinger Bands® – A Quantified Guide.
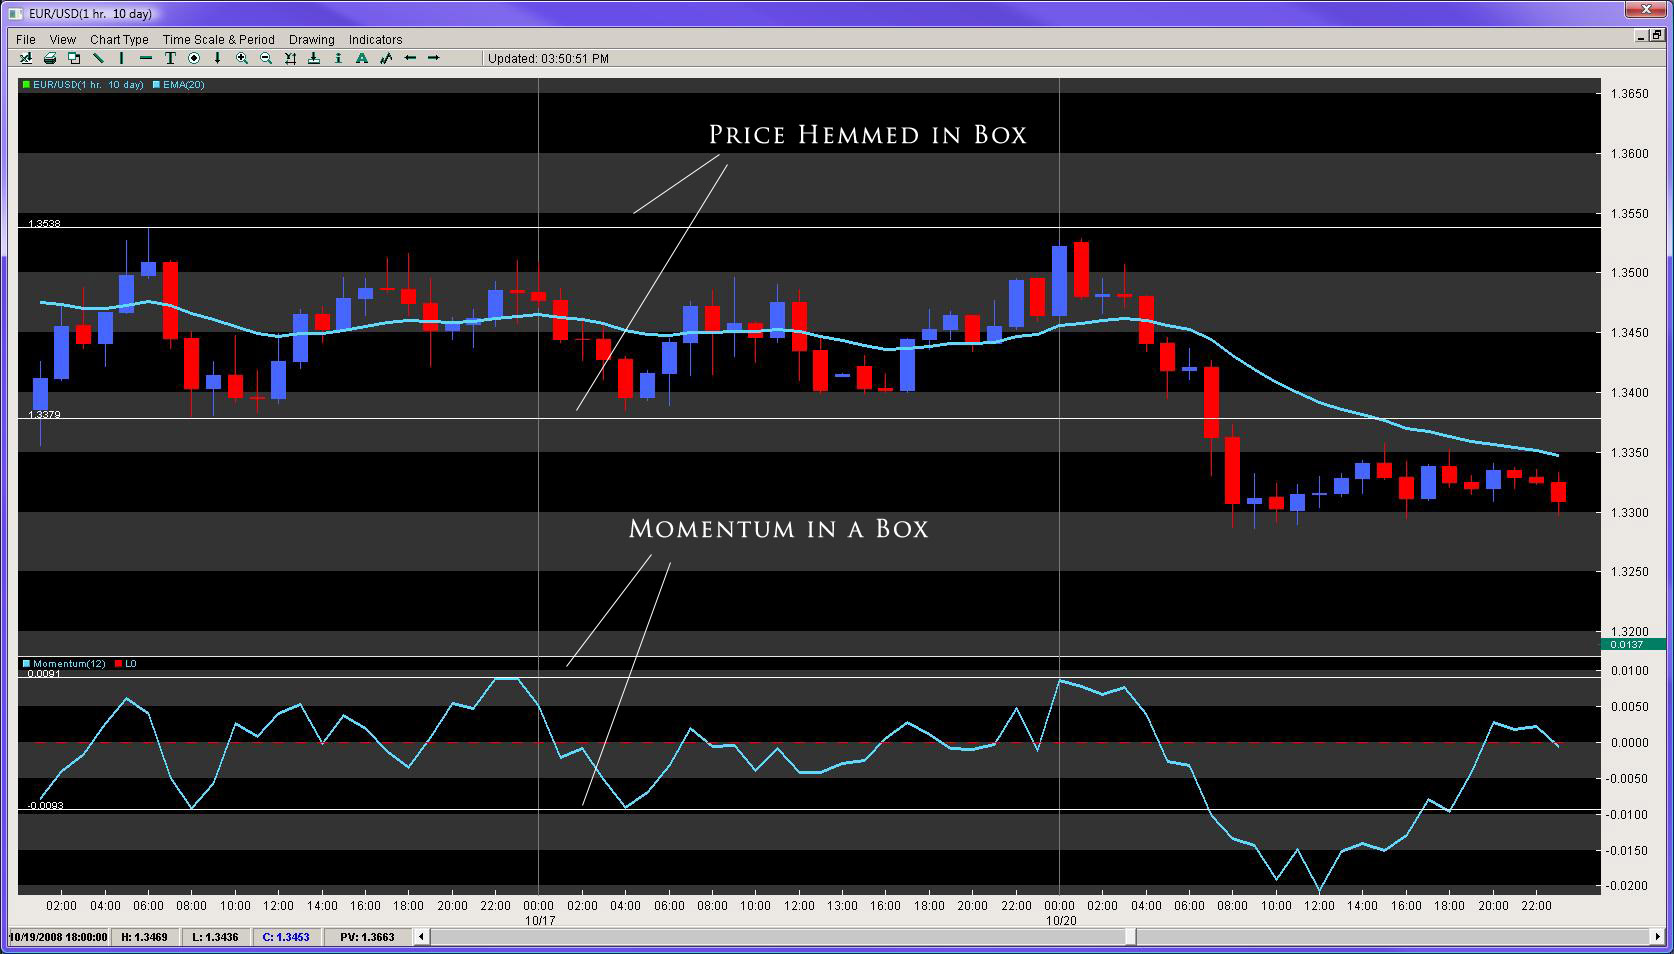
Looking at our first chart, figure 1 is the EUR/USD on the 1hr chart. For now, concentrate on the 48+ hour price action hemmed within a 190 pip range on the pair as delineated by the two white horizontal lines on the chart. Now also take note how the momentum indicator got hemmed into a tight range or ‘Momentum Box’ as well during the same time period. When the momentum indicator gets confined in such tight parameters, its telling you the internal momentum for the pair is clearly weak and that the order flow behind such price action is neither favorable for a bullish/bearish move.

Essentially, the order books are about fairly even and the institutional players are deciding upon the next move but have not placed their bets at that point. This is where the box and the momentum indicator can tell us when the range is going to break and how to trade the move. This method is also generally applied to the 1 hour chart but can be applied to daily time frames as well.
Remember, currency pairs are like humans – they do not like to be caged in small spaces for a long period of time. As it stands, the EUR/USD is averaging about a 230 pip range from top to bottom on any given day (via the ATR). Now mind you, the two day range this pair was hemmed in was about 195 wide. This generally creates a cabin fever for the pair and the resulting breakouts are usually forceful. In essence, this two day range which was 20% smaller than the pair normally moves on a single day. This is like living in a lower Manhattan studio apartment you bought for 300k. Anyone living in such circumstances would go batty or never come home since they would be living, eating, bathing, and sleeping in a virtual closet.
The point being made here is the market usually busts out of these shackles, and embarks upon a powerful move. The momentum box in these situations is great to get us in and out of the trade.
So looking at the figure above, we can see the two lines the momentum indicator was also hedged between. Generally, I require two peaks and troughs in place for it to be an official box. Once I have these parameters, I wait for the momentum indicator to spill out of the box.
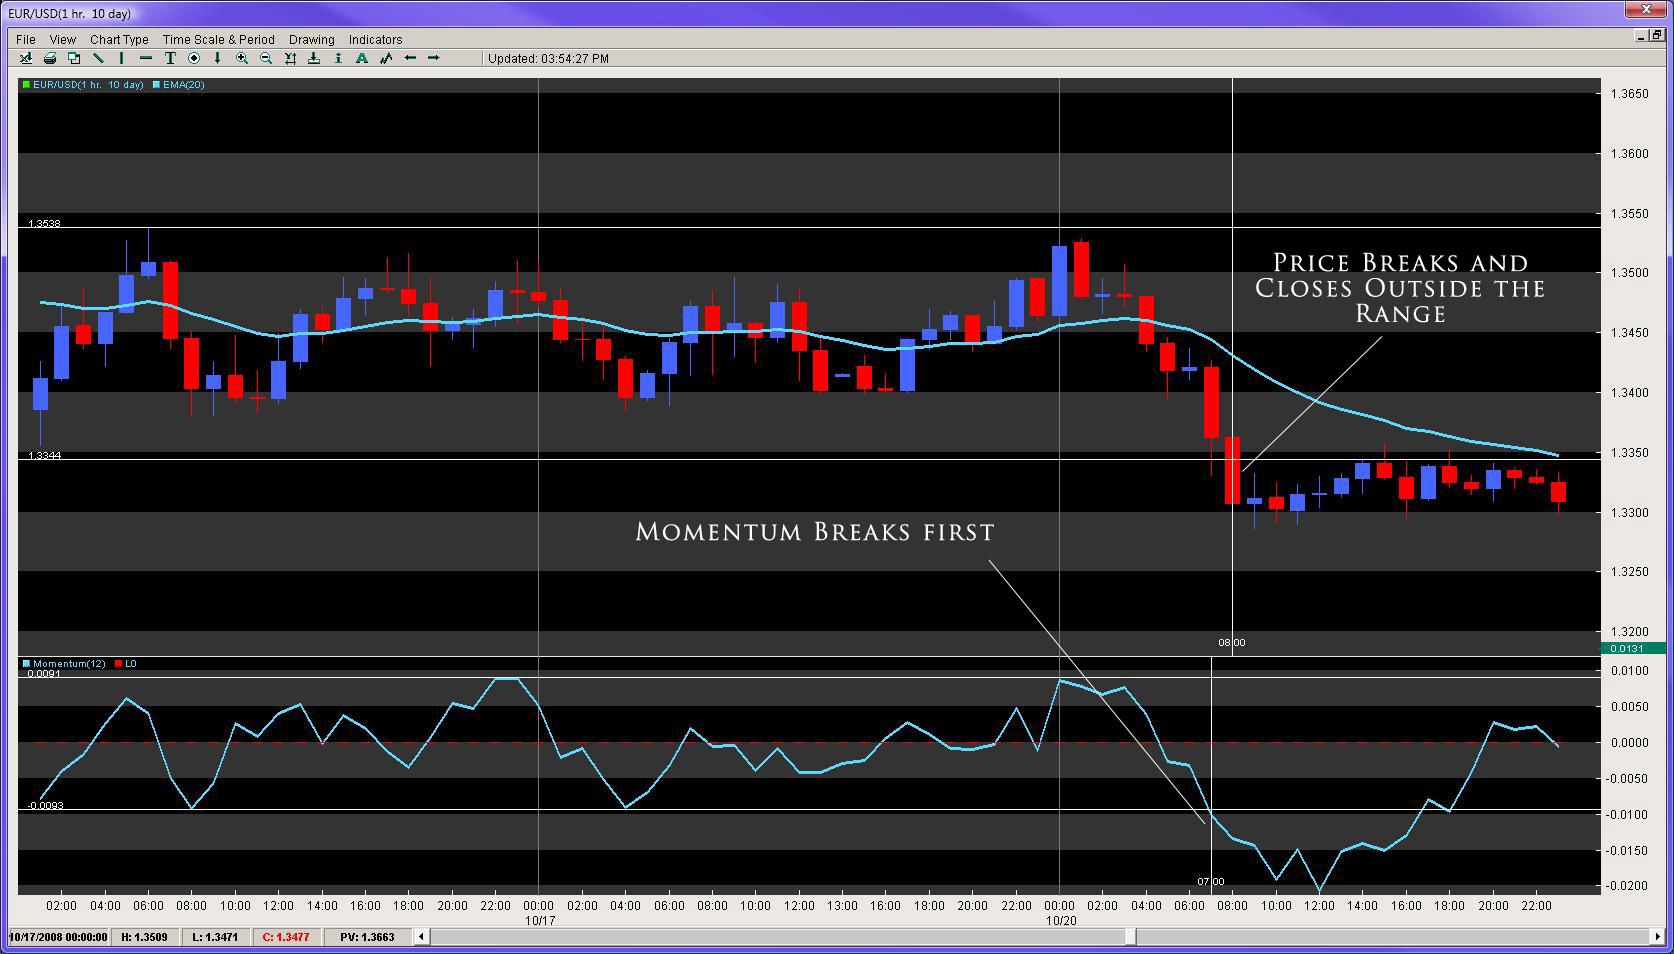
Momentum is generally a leading indicator, and will often move before price action does. Figure 2 shows us below how the price action finally broke and closed out of the range, but one candle before, Momentum has spilled out of the box telling us a breakout was in play.

How to Trade This
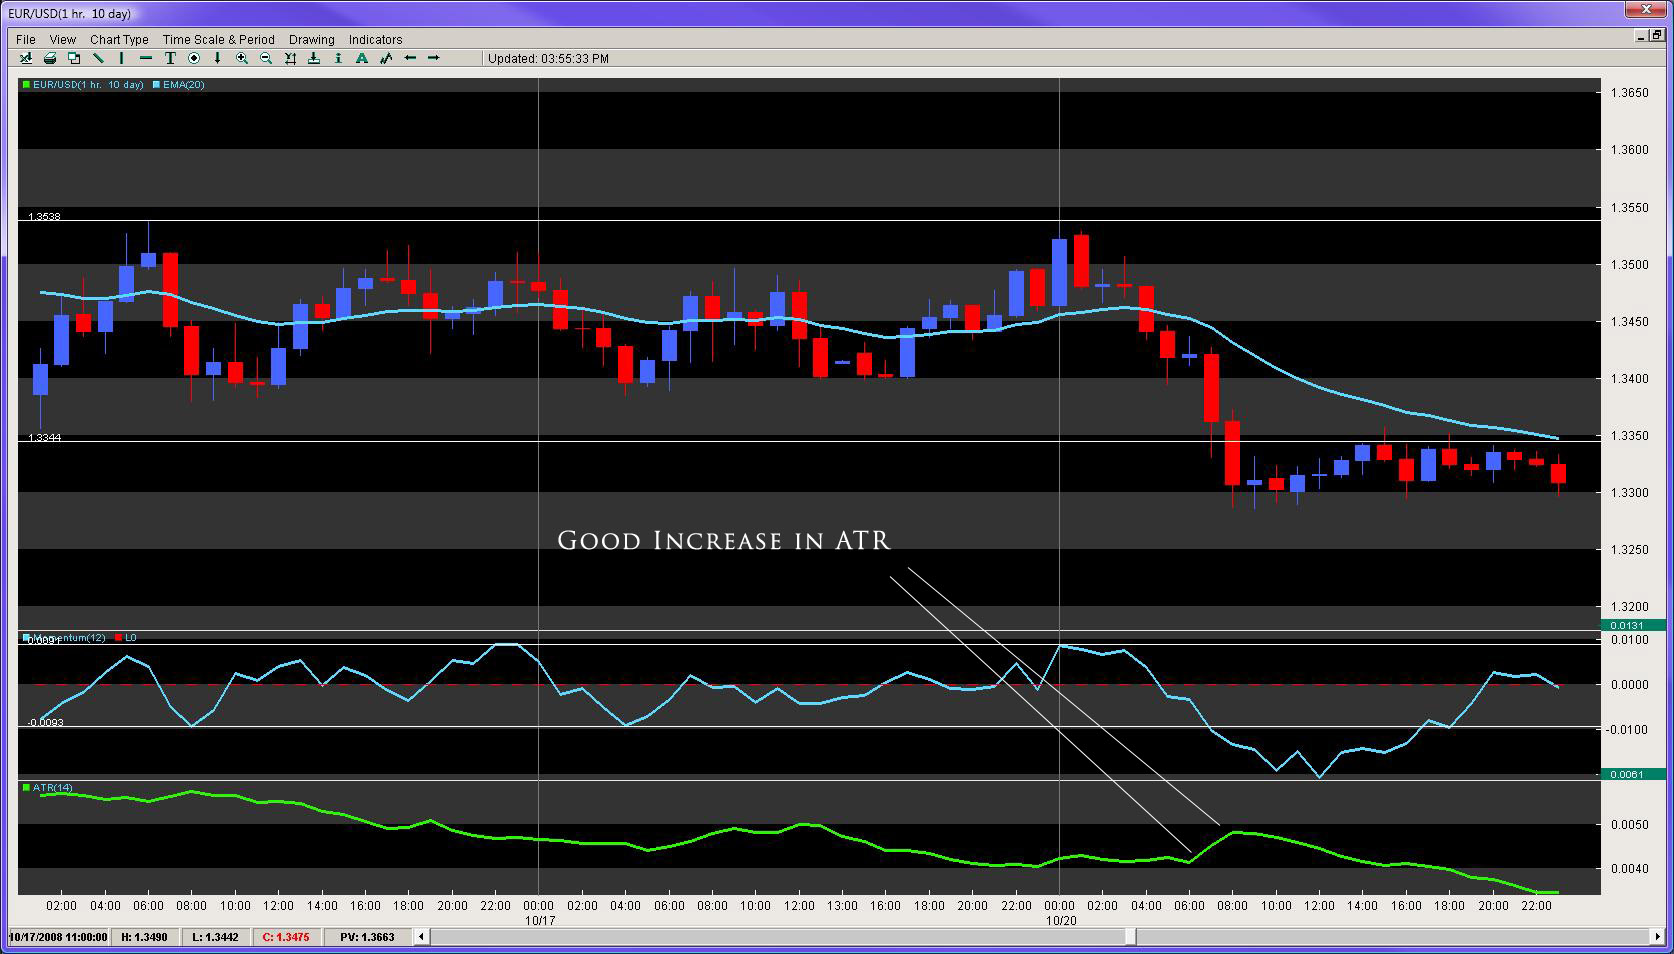
Looking at figure 3, we will see the same chart with an additional indicator, the 14-period ATR on this 1hr chart. The general method is this:
Once you have your boxes in place and you see the momentum spill out, we want to apply one more filter to qualify the trade. Using the ATR in combination with the momentum, you will want the following changes within the two indicators. First, you will want momentum not only to be moving in the direction of the breakout, but at least have an approximate 25% adjustment in the momentum reading. The hour before the price broke and closed outside the range, the reading was at -.0102 and the reading on the breakout was -.0134 (about 30%).
Second, you will want ATR to be increasing by at least 5%. Eight percent is better and above 10 is really good confirmation. The reason for wanting an ATR increase is if its a legitimate breakout, volume and volatility should be increasing by at least 5%. If its decreasing, the breakout is unlikely to produce something significant because the order flow is not behind it. When order flow increases in one particular direction, the ATR should increase with the newly added order flow. The hour before it broke out, the ATR was reading .0045 (about 45 pips per hour) and after it broke was posting .0048 clocking in a 6.67% increase. When we have such a confluence between the Momentum Box break, 25% change in momentum (aligned with the direction of the move) and the +5% increase in the ATR, we take the trade with two lots on the position. We have two methods as to how to get into the trade.

1) Take a two lot trade in the direction of the break, and place your stop about 15 pips on the opposite side of the 20 EMA (more aggressive) or
2) Wait for a retest of the previous floor and wait for it to become resistance via a role reversal (more conservative) and place the stop at the same level This is vice versa for a breakout to the upside.
Our initial target should be 51 pips whereby we bring the stop to free/break even and trail the second lot. We can trail the second lot using a couple of options as well.
1) Trail the second lot with the 20 EMA and the first candle to close on the opposite end of the 20 EMA is an exit signal for us on the close of such a candle.
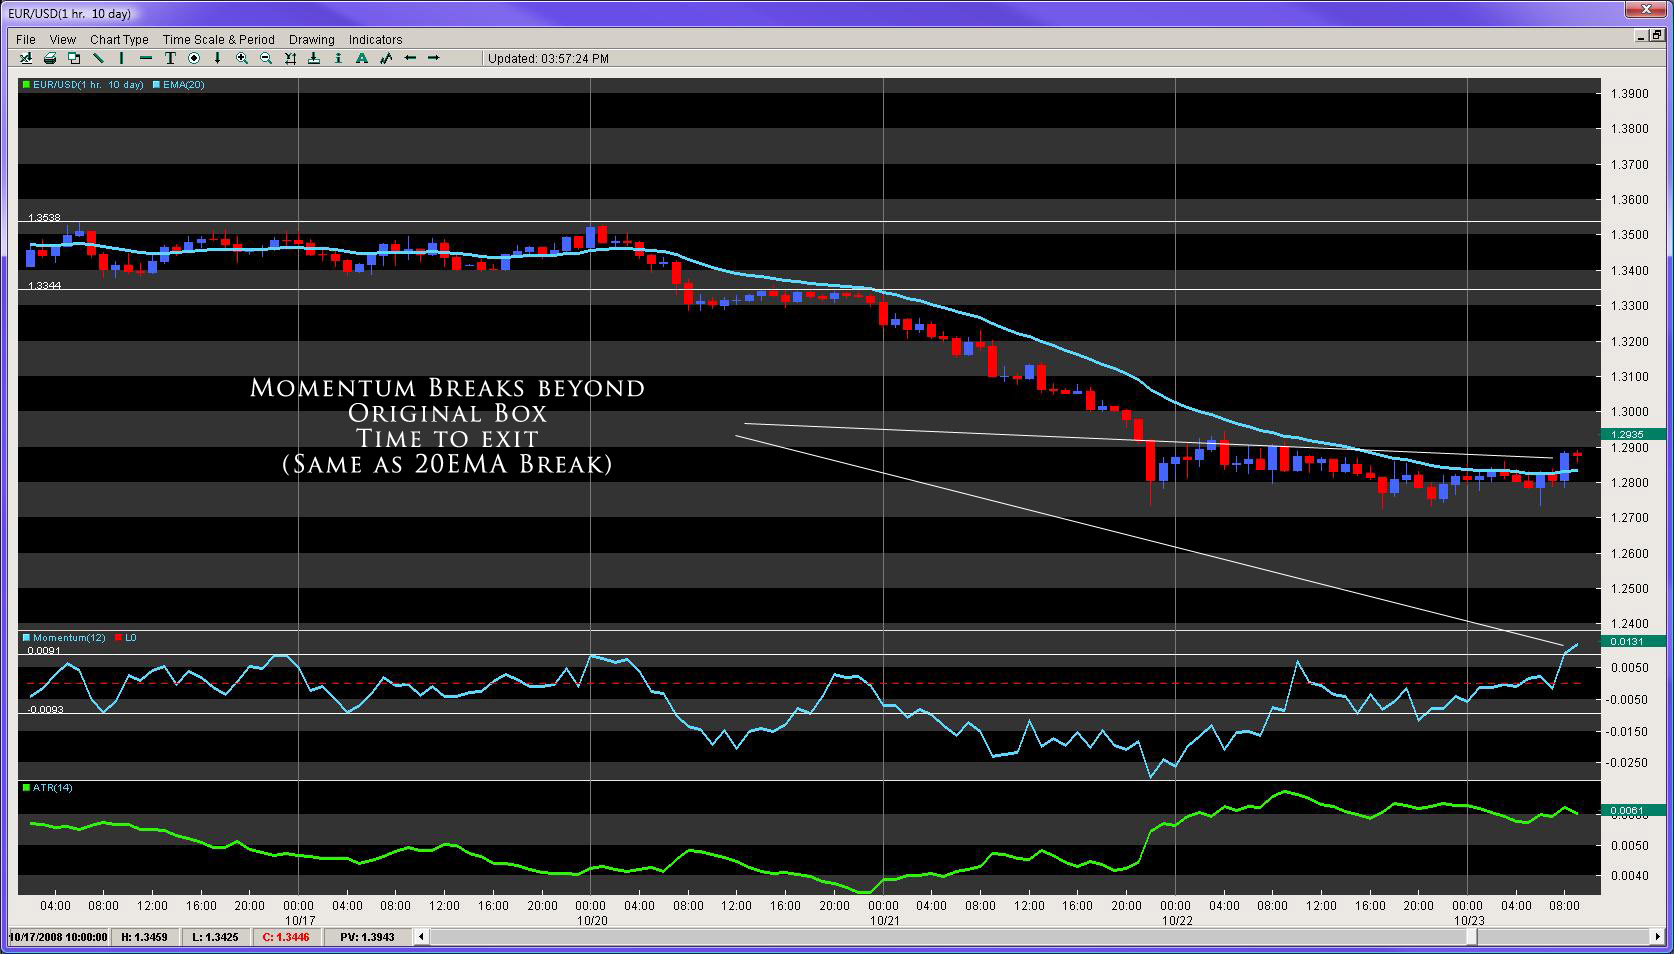
2) Ironically, we can use the momentum indicator and the original Momentum Box as our exit. Looking at figure 4, we see the original lines for the box. When the momentum indicator pierces through the opposite end of the box from the break, we exit the position. Thus, if it broke to the downside, we look for momentum to pierce the upper part of the box. Once it does, we exit the trade on the moment it breaches it. Coincidentally, this happened on the exact same candle as the 20 EMA breach.

Pick your poison.
Pairs to trade this on, I recommend only using this on the following pairs; EUR/USD, GBP/USD, USD/CHF. You can try it on the EUR/JPY and GBP/JPY since they have sufficient volatility to produce big breakouts. Generally, we would want 24 hours or more of consolidation which would represent three sets of order books between London, New York and Tokyo sessions. The longer the consolidation, the better.
Again, think of the 300k lower Manhattan studio apartment.
Chris Capre is the Founder of Second Skies LLC which specializes in Trading Systems, Private Mentoring and Advisory services. He has worked for one of the largest retail brokers in the FX market (FXCM) and is now the Fund Manager for White Knight Investments (www.whiteknightfxi.com/index.html). For more information about his services or his company, visit www.2ndskies.com.
