How Intraday Volume Can Be Used by Day Traders
What stands behind the volume?
The volume indicator is one of the most frequently used tools in trading, representing the amount of shares traded in a particular time frame (bar or candle). We all know that the volume is an actual number of shares exchanged between buyers and sellers. From this we can say that the higher the volume indicator, the more shares been exchanged on a particular time frame.
Click here to learn how to utilize Bollinger Bands with a quantified, structured approach to increase your trading edges and secure greater gains with Trading with Bollinger Bands® – A Quantified Guide.
The higher number says to us that there is either a big demand for a stock or a big supply. If there is a big demand for a stock, then the stock price will likely to go up, and if there is a great supply on the market-the stock price will likely go down. The higher volume number can be either steadily growing on the indicator window or shave an instant spike. Either way it gives us a very important signal that we can apply to our trading.
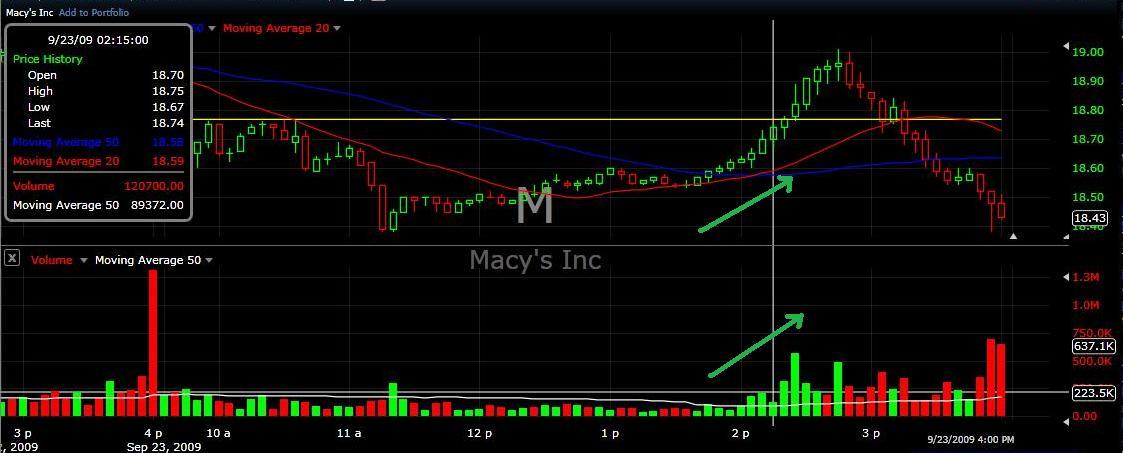
Let’s look at the example below. On picture 1 the demand is steady, the volume always present and the stock price growing steadily.
Picture 1
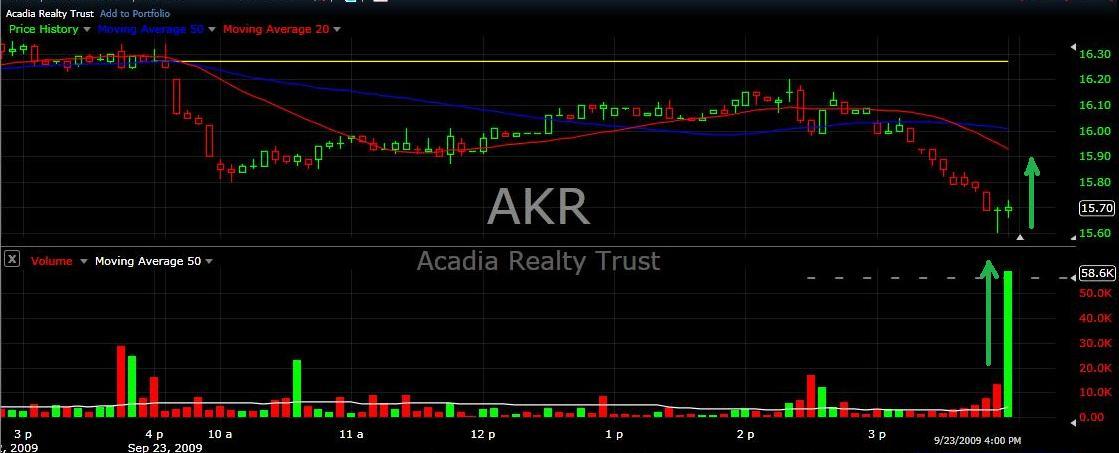
On picture two, we have a spike of volume and in this particular case it is a huge demand, which pushes this stock higher.
Picture 2
These two scenarios can be used to identify either continuation of the trend or reversal of the trend.
In first case the demand for the stock is steady and buyers are willing to pay higher prices when buying the stock, so the stock prices is also growing steadily.
In the second scenario, the demand for the stock was weak, but at the certain price level, in our case it is $15.70, the demand for the stock rose significantly and the trend reversed, sending the stock price higher.
These scenarios can be found easily throughout the day and you probably came across of them many, many times already, so now please use these little hints in your daily trading. This will increase your gains and definitely improve your P&L report.
Happy Trading!
Roman Larionov is the founder of the Absolute Resolution Project, managed by the Absolute Resolution Consultants – New York based consulting company established in 2007. He has 12 years of experience including senior and executive management positions, project management, revenue management, sales, product development, people management and customer service. His trading experience includes 8 years of trading FOREX and NYSE equities.
Mr. Larionov holds two Bachelor’s Degrees in Management and Management of Crisis Situations along with the MBA degree in International Business.
Backtested on over 17,000 trades test this new trading indicator for Leveraged ETFs and find high probability setups daily – click here now.


