How Lower Volatility Impacts Day Traders
Financial markets tends to have a distinct personality in each calendar year. Some years mark epic trend moves. Others note the emergence of one new market or another. This one, year 2009 will be best remembered for the historical rally from early March lows to wherever peak highs in stock markets finally find themselves by year’s end. It is also a year of the U.S. Dollar destruction… a chart drilling itself straight south into oblivion. But that’s an entire topic in itself best left for a different time. For stock index traders, 2009 has been a year of withering volume and waning volatility that caps two prior years of unprecedented measures for both. In a word, “pace”. The true pace of market action, heartbeat of upticks and downticks has noticeably changed this year.
V-Turn In Volume Versus Price
It used to be a market axiom that market bottoms needed high-volume sell offs and then follow-through days soon after. The dips should be on lower volume while the subsequent lifts from there should see higher volume again. In other words, classic signs of active accumulation by mutual funds, pension funds and institutions… big-money “commercials” in the market buying the market.
Chart 1
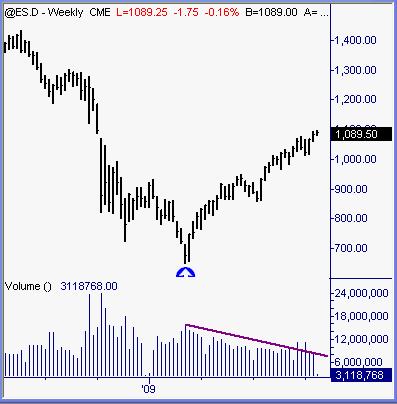
A look at the weekly chart of ES shows the daily run-rate in E-mini contracts traded in a steady decline since the bottom lows, early March of this year. From 17mil ~ 18mil contracts or an average of >3+mil per session has dwindled to an average of less than 10mil per week or <2mil ES contracts daily. We’ll get back to that topic that a bit later on.
Range Reduction
Needless to say, intraday price ranges from high to low to high to low swings have also shrunken measurably. Perpetual price flow from one peak to another and one trough to the next in between peak highs has flattened. The valleys are shallower and the hills flatter during regular trading hours for stock markets. A lot of directional movement has come through overnight gap-up moves on thin futures volume that holds for days or weeks as price action continues to bleed upwards.
Chart 2
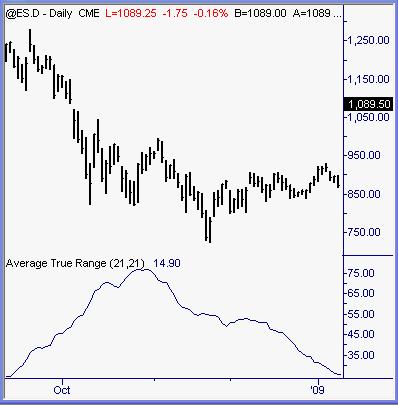
Late last year through the start of this year measured true-range for sessions running above 30pts ES intraday. That was a wide, highly active period of time for trading. Very “inefficient” markets, to use that phrase. Price swings were flying all over the place, all day, most every day. Some huge directional trend moves took place inside the regular session open & close. Between the bells, things were wild.
Chart 3
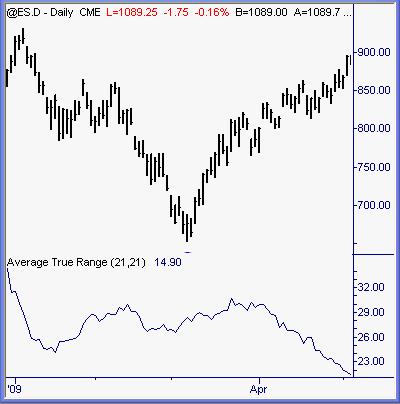
We began this year as a follow-through continuation from 2008 with generous intraday ranges and volatility. January until April, a seasonal time for active stock markets was exactly that. No complaints by anyone about that aspect of market action.
Chart 4
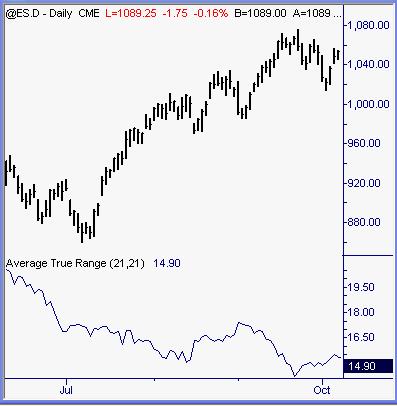
But the stretch of late spring through present time here in mid-October, intraday ranges (volatility) has absolutely collapsed. Imploded. While stock markets have marched relentlessly higher, new investors have disappeared. All that proverbial “money on the sidelines” remains right there, growing moss while the historical rally grows shorter and stubbier legs.
From a day-trader’s perspective, E-mini index markets are no longer bountiful and inefficient as they recently were. They’ve become very efficient by relative comparison: moving from point A to point B in the least amount of time while churning sideways for the majority of time. Financial markets exist to shift wealth. They exist to spread risk by distribution through dilution. Some times that shift of wealth is easier to one side than another… from weak traders to skilled traders. That’s what years 2007, 2008 and early part of 2009 were all about. Traders who thrive on volatility, trend and “pace” were living out their deepest market fantasies in that period stretch.
Dried Liquidity
Back to that issue of market volume, or lack thereof.
Chart 5
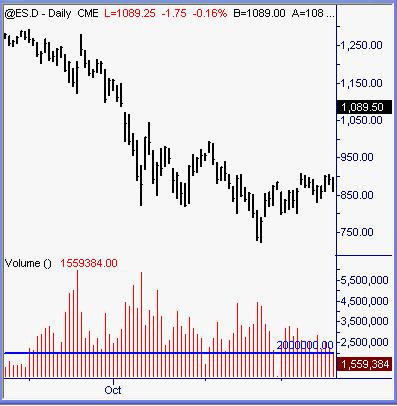
Using a mendosa line of two million ES contracts daily, it’s pretty clear that was a low mark of activity between the bells at this time last year. The meat of that market collapse saw intraday levels of 3+mil to 5+mil contracts regularly. A lot of volume, record volume actually pushed price action around in similarly record levels. Computer programs, bots arbing price changes across different markets and exchanges, fund liquidations from investors bailing en masse, banks collapsing all played a mixed role in there. Bottom line is volume stayed well above line from September through December 2008.
Chart 6
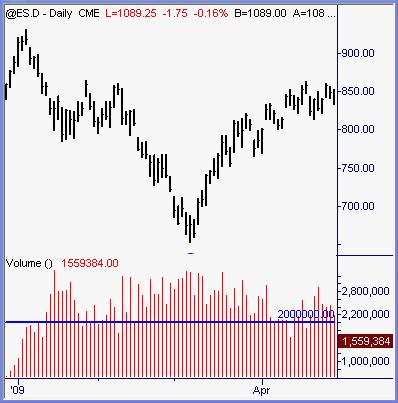
That same 2mil ES contract intraday benchmark was held well above all through the first quarter of 2009. As selling continued, volume paced high. Computer program trading along with investor liquidation remained steady. But soon after the recent market bottom was in place, it all changed from there.
Chart 7
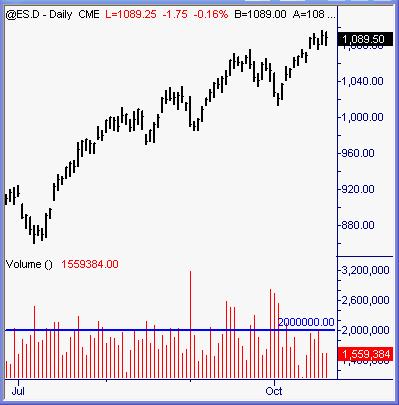
Someone or something still has to feed those incessant computer programs… which comprise much if not most of the average daily trading volume now. The black-box program bots have to eat something (someone) every day. Where are their meals coming from? With liquidity (volume) drying up on a gradual but consistent basis all year, what’s left to fuel the market between bot-driven program slams?
Not much. Which is why we see so many sessions where price will hang in a 2pt to 4pt price channel, drifting sideways for hours on end between brief episodes of directional price spikes or swoons that comprise the day’s measured range. A 15pt total range from highs to lows last year (and prior years) behaved much differently than it does now.
Manner Of Movement
Traders who lived through, survived or thrived in that period of epic volume and volatility understand exactly what we mean by current lack of market pace. For two years and part of a third (early 2009) we enjoyed price swings and ranges that were frequent, steady and expansive. Price would make deliberate moves from consolidation to expansion, back to consolidation before the next ensuing expansion. The eternal ebb & flow of market action.
Normal to high volatility markets have a steady to quickened pace. Consolidations are minimal and structured between expansions. The market is orderly… rather simple to read. You can literally see which side of buyers and sellers are prevailing by watching formation of price bars. Energetic surge moves higher followed by low-range, subdued bars lower means pressure is upside. When the low-range pullback bars begin to expand and pop upwards into resistance, it’s clearly visible what comes next more often than not. Only a matter of where exactly to get in for the follow-through moves from there.
Low volume = volatility tapes have a different characteristic. There is no visible ebb & flow of price movement. Bars on the chart will spike up, surge down and chop sideways in seemingly random fashion. The patterns of behavior are clouded and muddy. It takes more work, more effort and more skill to discern true pullbacks and breakouts from consolidated noise.
Limited Opportunity
The transition to more efficient stock index markets means less opportunity for profit. In other words, the wild markets of 2007 ~ 2008 were much more forgiving of mistakes. There were multiple oscillations and swings, several chances per day for modest to big-profit trades executed. Compare that to now, where the intraday session often makes one directional push in 6.75 hours between the bells with nothing but congestion and fuzz otherwise. Endless price channels consolidation where the ES does not exceed 3pts range for literally hours offers no profit potential to anyone.
Inside those less efficient stock index markets prior, we could be a bit sloppy and still prevail… markets were much more forgiving. Now it’s critical to be sharp, precise and exacting when measuring price action for high-odds trade entry AND management aspects of execution through exit. Gone (for now) are the multiple price swings and big ranges that wipe out numerous little mistakes. In their place are scant few price swings and multiple sideways oscillations which wipe out errant entries and stop-loss orders instead.
This transition from high energy to low energy markets is akin to that proverbial frog in a frying pan parable. The frog keeps applying suntan oil until he realizes that it’s truly cooking oil instead. By the time that realization is made… it is too late. Frog-legs parmesan is the end result. Stock index traders use similar failed attempts at dealing with increased pressure and heat on their open trade positions. Widening stops (risk) and narrowing profit objectives (reward) is one of several human-logic decisions. The answer to repeated stop-outs in sideways price action is simply wider stops. Right? Easy fix for that problem right there? Alas, no one has ever (or will ever) enjoyed long-term profitable success applying bigger risk to smaller reward ratios in trading. Something about the universal laws of statistics and trade costs involved there that trump shallow-levels of human logic. Every time.
Similar to the il(logic) that scalping for tiny profits is somehow a controlled-risk or safe trading approach. Long story short, by the time traders realize who is the one that’s actually scalped in this endeavor, their trading account is terminally bald.
Summation
Now more than ever, extreme levels of professional patience from traders are required. Hours of nil opportunity for profit inside E-mini markets means patiently sitting on hands waiting for the cards to be dealt our way. It may mean giving some attention to other semi-correlated markets such as currencies, crude oil, grains or gold. It often means both.
One thing is for sure: ES intraday volume has dropped by at least one-third of prior highs if not one-half from those peaks. Where did that volume go? Part of it was hedge funds and retail traders alike who are gone and won’t return. Another part of it is probably in cash. An additional part shifted towards other financial markets outside of stock index E-mini contracts. All of it is absent right now, which has a direct impact on intraday price action and pace. That much is also for sure.
Patience. Discipline. Wait for the clearest trade setups to confirm. Honor initial stops for risk. Manage performing trades for efficient performance. In other words, cut losses short and let winners run appropriately. When profitable early on, know when to fold ’em and walk away. That’s the mode for 2009.
Austin Passamonte is a full-time professional trader who specializes in all commodity markets. Mr. Passamonte’s trading approach uses proprietary chart patterns found on an intraday basis. Austin trades privately in the Finger Lakes region of New York. Click here to visit CoiledMarkets