How PowerRatings Can Help You Trade Head And Shoulders Patterns
In today’s
PowerRatings
strategy we’re going to take a look at how you can combine
PowerRatings
with traditional technical analysis methods.
Red Hat
(
RHAT |
Quote |
Chart |
News |
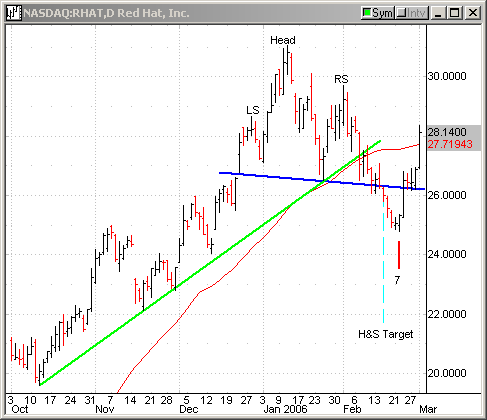
PowerRating) has been in an uptrend since May 2005. If you look at the
chart, you’ll see a number of common TA techniques. We have a trend line (green),
50-day moving average (red) and what looks
like a head and shoulders pattern (with the neckline in
blue).
All of these tools came together recently in what looked like a bearish
alignment. RHAT broke its trend line, declined below the 50-MA and completed the
H&S pattern by closing below the neckline. This should lead to a decline at
least equal to the size of the pattern (H&S Target –
dashed blue line).
However, as you can see on the chart, that didn’t happen. After falling below
the neckline RHAT only declined for a few days before reversing sharply,
breaking back above the neckline and it has since extended its gains.
On the day RHAT made a new low then reversed to close higher, it recorded a
PowerRating
of 7. At the very least this should have been a
warning sign to anyone holding a short position that the stock was likely to
rally. This information is useful as it can help you decide what course of
action to take. You could close out your short, reverse to long, move your stop
loss closer, hedge with options, etc.
And remember a failed pattern can be useful, too. Once you realize the H&S top
has failed and the stock is no longer about to decline, it can only do one of
two things — go higher, or trade sideways. And with RHAT already having a
PowerRating
of 7 you know the odds favor an advance, providing
you with a good opportunity to go long. In this example, RHAT gained 11.14% in 5
days.

Click here
to take a free trial of
PowerRatings.
You can also
attend a free
class on how to use
PowerRatings
presented by Steve Primo, our Director of Education.
Ashton Dorkins
Editor-in-Chief
