How Ratios Can Help Predict Reversals in Stocks
After 45 years of trading and studying the financial and agricultural markets, I’m often asked what the most defining moments were in my education and career. Actually, that moment spanned 4 years from 1983 to 1987.
Soon after leaving the floor of the Chicago Mercantile Exchange after a 3 year stint as a floor trader in the S&P pit and Currency pit, I went to work for Commodity Corporation in Princeton, NJ. At that time I had found an obscure book called Torque Analysis of Stock Market Cycles by William Garrett. This book was published at the exact same time as James Hurst’s Profit Magic of Stock Transaction Timing. Both authors were engineers.
Click here to order your copy of The VXX Trend Following Strategy today and be one of the very first traders to utilize these unique strategies. This guidebook will make you a better, more powerful trader.
Hurst’s book was heavily promoted and only cost $10.00.
Garrett’s book was $30.00 and only sold 200 total copies.
On page 89 of Garrett’s book, he described the relationship of how squares, circles and triangles appear on a price chart in natural Fibonacci progression.
By using the Fibonacci summation series, he described how right triangles are quite predictive in nature. This article focuses on what a ratio and proportion is by using these right triangles. Trust me when I say this is not advanced mathematics. This is simple addition, subtraction, multiplication and division.
It’s impossible for me to describe in a few words the significance of these two charts. I have been using the same type of analysis for the last 25 years and it’s the most important thing that I’ve ever learned in 5 decades of trading.
What you’ll learn from ratios and proportions of swings will depend on the amount of time that you spend studying and applying the principals.
4 reasons why ratios and proportions are so important
1. Markets can only do one of 3 things: go up, down, or sideways. It’s
the job of the pattern recognition swing trader to determine whether you have
an uptrend (higher lows) or a downtrend (lower highs).
2. Markets repeat with clocklike regularity, they do the same thing every
day.
3. Ratios and proportions are leading indicators indicating the future of
price movement as opposed to lagging indicators like oscillators, moving
averages and Bollinger bands.
4. Each right triangle has a predictive nature making the risk/reward on each
trade solidly in the traders favor.

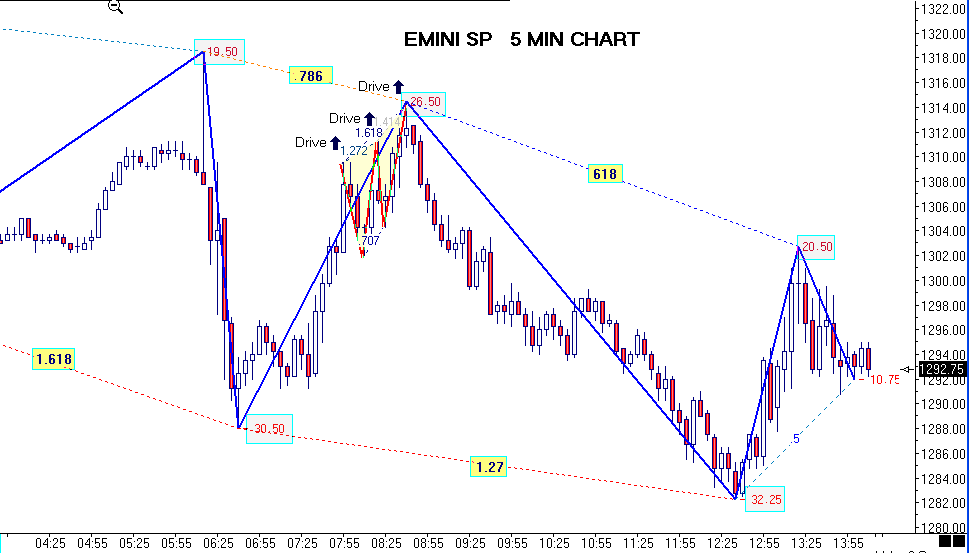
This first chart is an Emini S&P 500 5 minute chart. As you can see there are 4 right triangles highlighted. All of them can be described by the numbers .618, .786, 1.27 and 1,618. There is also a 3 drive pattern culminating at a .786 retracement. This is an example of using pattern recognition and price swing analysis to find low risk buy and sell points.

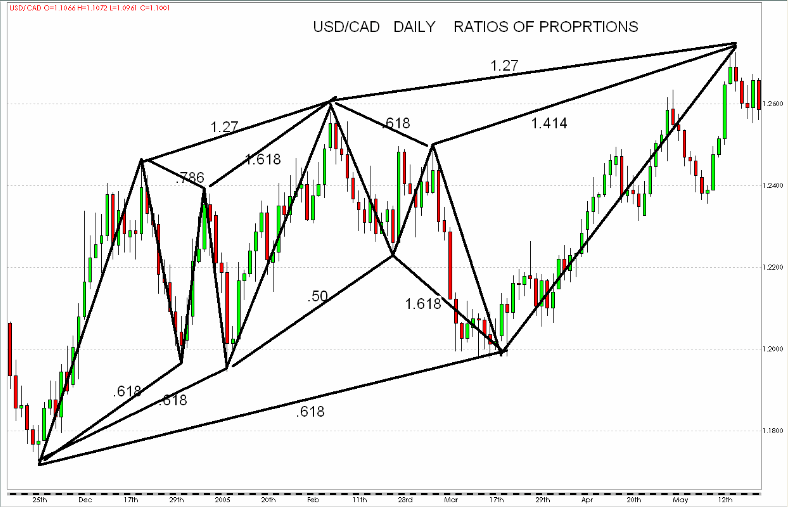
The second chart is a US Dollar/Canadian Dollar chart on a daily basis. As you can see the market is nothing more than a series of right triangles. All swings on every chart are related to every other swing in some ratio or proportion. As a starting point if we take the lowest part of the US Canadian Dollar chart from November 25th up to the high on December 17th we can see that the first price swing culminated at the .618 retracement. With those 2 price swings, all other futures wings can be related to by the price relationships that are shown on the chart. My defining moment was when I realized that every triangle was related to every other triangle by the relationships in the Fibonacci series. If the reader will study each swing and see how it compares to each successives wing I would hope that it would be the epiphany that it was for me.
Fair warning, it is not easy to try and understand this, it takes time and most importantly effort. Most people will have to look at hundreds of charts before they see how all relationships are related to others but if they will take the time to do this what will be revealed will hopefully change there lives as it did mine.
Larry Pesavento is a forty year veteran trader. For more information on his trading strategies go to
www.tradingtutor.com.
