How The FCC Created A Potentially Nice ‘Pairs’ Trade
Today’s FCC ruling threw many telecom stocks into
a tail spin. The official news release can be obtained from
www.fcc.gov . With this kind of news and price movement, I had to go digging
into these companies to see what was developing. Rulings like this will hurt
some carriers more than others and it will (in my opinion) be reflected in the
charts and price action. I think the great example in this situation is between
(
SBC |
Quote |
Chart |
News |
PowerRating) and
(
VZ |
Quote |
Chart |
News |
PowerRating). SBC appears to be dealt the poor hand in this situation
and looks to be headed to significantly lower levels while VZ is setting up for
a potential long trade based on Fibonacci analysis.
First, let’s look at a chart of
SBC. I’ve labeled each of these points on
the chart:
-
The trend is definitely in
place to the downside as each countertrend rally since 2000 has been between
11 and 14 weeks. The rally that ended recently was 14 weeks and just over 12
points. -
The .786 retracement of the
October 2002 low to January high was violated today, which suggests to me that
we go lower. -
Lower is defined as a support
area from $15 – $16.

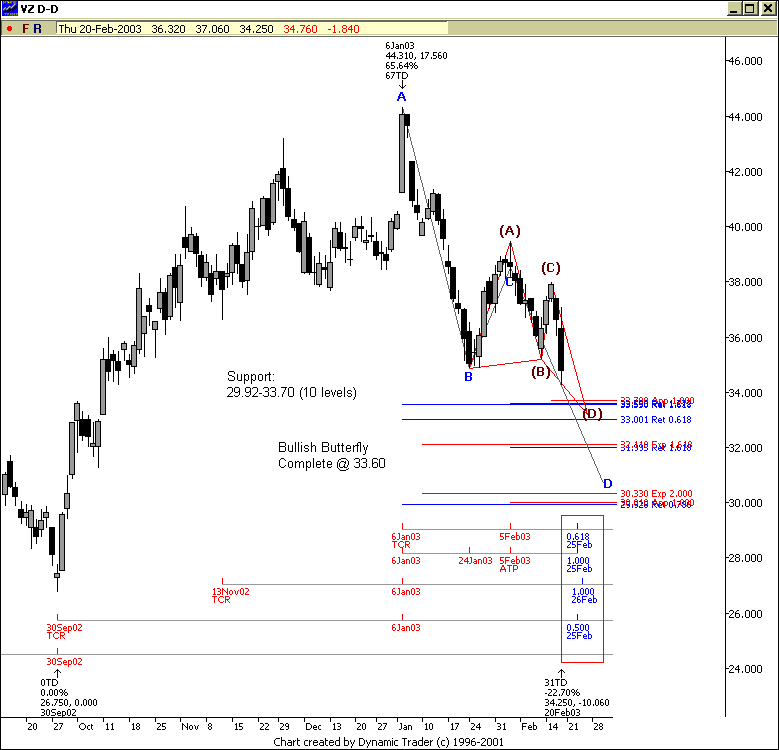
 Next, take a look at a daily
chart of Verizon
(
VZ |
Quote |
Chart |
News |
PowerRating). This is a much
different scenario:
-
Although the long term trend
is down, we have held much higher levels since the January sell off began in
relation to SBC. -
VZ
is hitting a large Fibonacci price support zone from 29.92-33.70. There are 10
levels of confluence here. -
There are also 4 time cycles
pointing to an upside reversal early next week between February 25-26 (+/- 1
day). -
There are two bullish
patterns in the mix here as well.a.     Â
An AB=CD two step pattern from the
Jan. 6 highb.    Â
A Bullish Butterfly pattern that
completes at 33.60.

 So, what will I be doing here?
First, I’ll be looking for long trades on VZ against this Fibonacci price
support zone. My stop on this trade if entered will be just below the price
support zone. Second, I will look for shorting opportunities in SBC against
Fibonacci price resistance on any rally. So, I’ll have a potential “pair†trade
(long and short in same sector)Â that develops out of this.
Have a great night.
Â
Â
