How to Exit an ETF Trade, Part 2
Click here to read Part 1 of How to Exit an ETF Trade.
In the first part of our discussion on exiting ETF trades, I stressed that part of what makes our high probability approach to ETF trading so straightforward for traders to follow is that we follow the same attitude toward entering ETFs as we do when it comes to exiting ETFs: we always buy weakness and sell strength.
In the context of exiting ETF trades, this means that when we are long an ETF that we bought when it was oversold and “weak”, we are looking to exit after that ETF has made a show of strength by moving significantly higher.
Similarly, if we are short an ETF that we sold short when it was overbought and “strong”, then our exit strategy will be to buy back or cover when that ETF sells off (a “show of weakness” if you will) and moves significantly lower.
Buy weakness and sell strength. Sell short strength and cover on weakness. This is our ETF trading strategy in a nutshell.
But what is a “show of strength” or a “show of weakness”? How do we know if an ETF we bought has moved “significantly higher” or if a fund that we sold short has moved “significantly lower” for us to begin looking into exiting the trade?
When it comes to ETFs, there are a few exit strategies that we have backtested and have produced good results in our testing. One of our ETF exit strategies, for example, is to exit ETF long trades bought on short term lows on short term highs. For example, a trader who bought the iShares FTSE/Xinhua China 25 ETF
(
FXI |
Quote |
Chart |
News |
PowerRating) on a 7-day closing low, might look to exit that ETF trade as soon as the ETF makes a 7-day closing high. This, if it looks familiar, is the backbone of one of our more effective ETF trading strategies: the Double 7s.
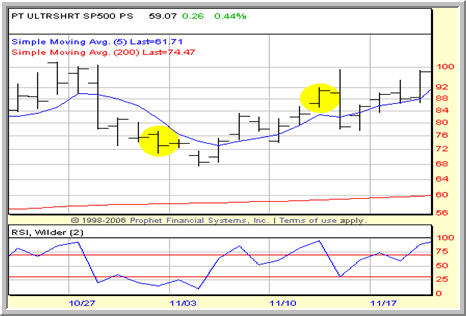
ProShares UltraShort S&P 500 ETF
(
SDS |
Quote |
Chart |
News |
PowerRating). Even when moving slightly lower after making a short term closing low, SDS resumed its upward movement with a few days after the pullback, moving to a new short term closing high.
Another approach to exiting ETF trades is to use the 2-period RSI. Remember what I’ll call our Golden Rule of High Probability Trading: buy weakness and sell strength. Here, consider the example of an ETF bought because its 2-period RSI was exceptionally low. One strategy for exiting this long ETF trade would be to sell the ETF when its 2-period RSI moves from the oversold range to the overbought range.
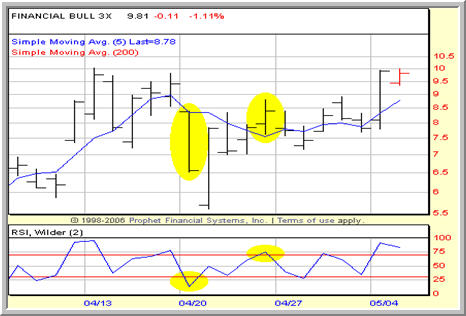
Direxion Financial Bull 3x Shares ETF
(
FAS |
Quote |
Chart |
News |
PowerRating). Here an oversold 2-period RSI dips below 20 on a closing basis on April 20. Four days and more than 50% later, FAS closed with a 2-period RSI of more than 70.
Both ETF exit strategies, exiting on short term closing lows and exiting as a 2-period RSI moves from oversold to overbought, are strategies that short term traders can use to make consistent, high probability mean reversion trades using exchange-traded funds (ETFs). Both exit strategies have been part of some of our most successful trading approaches — such as the Double 7s Strategy.
Click here to read the third and final part of How to Exit an ETF Trade. In part 3, I’ll present one of our most widely-used exit strategy for both ETFs and stocks: closes beyond the 5-day moving average.
According to a recent report, eight out of ten securities traded are exchange-traded funds. Want to learn how to trade them? Click here to order High Probability ETF Trading,the first quantified book of trading strategies to improve your ETF trading.
David Penn is Editor in Chief at TradingMarkets.com.