How to Exit an ETF Trade, Part 3
Click here to read Part 1 of How to Exit an ETF Trade.
Click here to read Part 2 of How to Exit an ETF Trade.
In the first two parts of our series on exiting ETF trades, I showed how our strategy for trading ETFs is based on the same fundamental trading strategies and methods that we have successfully tested and traded for years. This strategy, in short is this:
Buy oversold ETFs above their 200-day moving averages. Sell overbought ETFs below their 200-day moving averages.
In a previous series, we looked at different ways that ETF traders can spot oversold and overbought ETFs, as well as strategies ETF traders can use to take long positions in oversold ETFs and short positions in overbought ETFs. These approaches included using short term closing lows and highs (for long trades and short trades, respectively), as well as the 2-period RSI.
Here in the current series on ETF exit strategies, we have already looked at two different ways traders can exit both long and short ETF trades. One was to use short term closing highs as an exit signal for long trades or short term closing lows as exit signals for short trades. For example, an ETF strategy of buying at a 7-day closing low above the 200-day moving average might have a 7-day closing high as an exit.
The second exit strategy I shared involved the 2-period RSI. Here, the strategy involves exiting an ETF that was bought in oversold territory after it moves into overbought territory (or, conversely, exiting an ETF that was sold short in overbought territory once it moves into oversold territory). And, of course, our favorite tool for determining when a stock is overbought or oversold remains the 2-period RSI.
To finish off our series on exiting ETF trades, let me introduce what is probably our favorite exit signal. This exit signal has been so effective both in its application and in its simplicity that it has become an exit strategy that we have adopted for stock trading as well as ETF trading: a close beyond the 5-day moving average.
SPDRS Gold Shares ETF – GLD – Traders who took positions in an oversold GLD in mid-April could have used the close above the 5-day moving average as an exit signal.
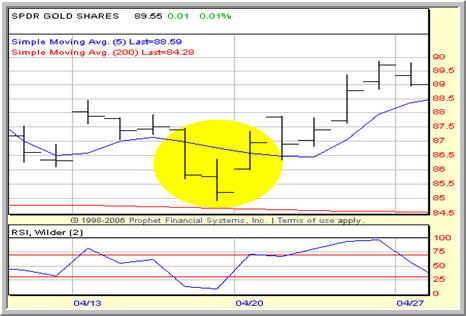
We have found in our historical testing – and in our real-world trading – that using the 5-day moving average has produced exit signals that are not only clear, but also help us fulfill what is one of our most important goals when making high probability, mean reversion trades: exiting long trades on strength and exiting short trades on weakness.
By exiting long ETF trades bought on pullback after the ETF has closed above its 5-day moving average, we are selling into increased demand – just as any merchant would love to do. And in covering short ETF trades once the ETF has closed below its 5-day moving average, we have a good idea that we waited for the kind of weakness that will make it more likely that our cover price will be significantly lower than our buy back price.
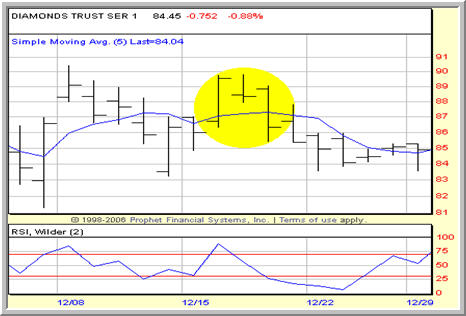
Dow Diamonds – DIA – Traders who bet against the DIA in mid-December 2008 could have used the close below the 5-day moving average as a signal to take short term profits.
All of the exit strategies in this series – as well as the entry strategies in the previous ETF series – have been tested on the most liquid exchange-traded funds available to traders and investors. Traders who are looking to put together their own ETF trading strategies based on buying weakness and selling strength should experiment with different combinations of these ETF entry and exit strategies to see which ones work best for them.
If you are interested in additional ETF strategies, then there is no better place to look than in the new book by Larry Connors, High Probability ETF Trading, now available for order. Click here to order your copy today.
David Penn is Editor in Chief at TradingMarkets.com.