How to Find and Trade Overbought and Oversold ETFs, Part 2
In the first installment of our discussion on overbought and oversold ETFs, I explained why we, as high probability ETF traders, use overbought and oversold conditions to help signal potential short term trading opportunities.
To recap briefly, whether markets are trending upwards, trending downwards or oscillating in a sideways fashion, markets have a tendency to move back and forth from overbought to oversold conditions. This movement is not mysterious – it is simply the product of the buying and selling of millions of traders and investors.
The insight of Larry Connors and Cesar Alvarez, authors of Short Term Trading Strategies That Work and, soon, High Probability ETF Trading, was that short term traders could take advantage of this natural market movement by waiting for markets to reach extreme levels of overbought and oversold. This strategy of selling overbought markets (that are below their 200-day moving averages) and buying oversold markets (that are above their 200-day moving averages) is the cornerstone of our high probability approach to short term trading.
According to a recent report, eight out of ten securities traded are exchange-traded funds. Want to learn how to trade them? Click here to pre-order High Probability ETF Trading, the first quantified book of trading strategies to improve your ETF trading.
The big question is how do you know when an ETF is overbought or oversold?
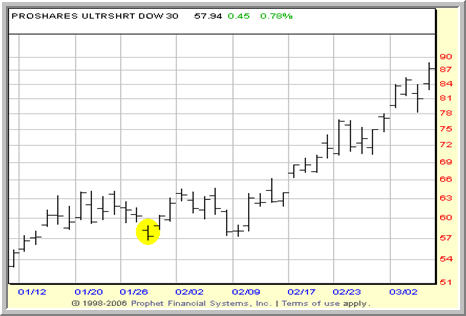
A short term closing low in the ProShares UltraShort Dow 30 ETF above the 200-day moving average appears just before the ETF begins making a major advance.

Today, I will present one method that any ETF trader can use immediately to know which ETFs are overbought from a trading perspective and which are oversold.
Another key insight from the research of Connors and Alvarez is that markets tend to perform better in the wake of short term lows rather than short term highs – especially on a closing basis. This has been a consistent finding in the research, whether the subject was the market as a whole, individual stocks or individual ETFs.
These findings, I should point out, are robust, meaning that the actual length of the short term low can vary without undermining the results. We have tested a variety of short term lows – especially closing lows – and found those around 7 days to be especially helpful in identifying potentially oversold markets.
Similarly, markets making short term highs, which have tested to produce underperformance in the short term relative to markets making short term lows, may be considered overbought markets from a high probability trading perspective.
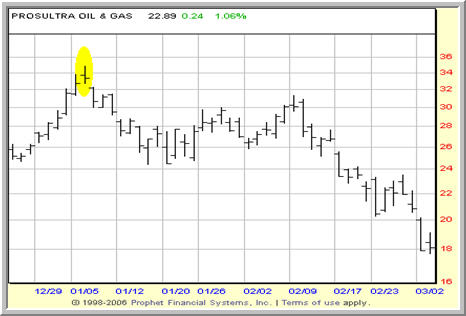
A short term closing high in the ProShares UltraShort Oil & Gas ETF below the 200-day moving average (not shown) signals a selling opportunity in DIG.

The research on these short term highs and lows (again, especially on a closing basis) was impressive enough that we built an entire ETF trading strategy around it. That strategy is called Double 7s, and was first introduced in our Swing Trading College (click here for more information about our Swing Trading College).
So if you are looking to buy oversold ETFs on pullback, look to see how close they are to their short term closing lows. If those ETFs making short term closing lows are also trading above their 200-day moving averages, then you just might have a trading opportunity to the upside on your hands.
Click here to read Part 3 of How to Find and Trade Overbought and Oversold ETFs, where I’ll present our main strategy for determining whether or not ETFs are overbought or oversold – and how to trade them.
David Penn is Editor in Chief at TradingMarkets.com.
