How to Find and Trade Overbought and Oversold ETFs, Part 3
Click here to read How to Find and Trade Overbought and Oversold ETFs, Part 1.
Click here to read How to Find and Trade Overbought and Oversold ETFs, Part 2.
In the first part of our series on finding and trading overbought and oversold ETFs, I explained the significance of overbought and oversold conditions and why we, as high probability ETF traders, think that these conditions provide the best information for traders looking to make high probability trades over a short 3-5 day timeframe.
Our research going back to the mid-1990s in the SPY and since inception for most other widely-traded ETFs tells us that there is a short term edge in buying ETFs that are exceptionally oversold and in selling short ETFs that are exceptionally overbought. This approach to trading is explained and discussed in great detail in Larry Connors’ new book, High Probability ETF Trading, now available for pre-order.
In the second part of our series, I revealed one basic strategy ETF traders can use to determine when an ETF is overbought or oversold. This strategy of looking to potentially buy ETFs making short term closing lows (short term meaning 5-9 days) and potentially selling short ETFs making short term closing highs is one that any ETF trader can include in his or her short term trading of ETFs. In fact, this approach is so robust that we have created an ETF trading strategy — the Double 7s Strategy — specifically designed to take advantage of this edge.
Here in the final part of our series on finding and trading overbought and oversold ETFs, I want to introduce what is probably our most valuable tool in determining whether or not an ETF is overbought or oversold: the 2-period RSI.
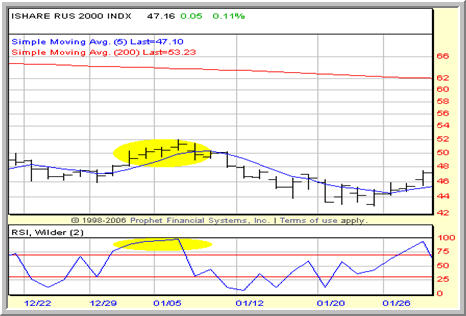
iShares Russell 2000 Index ETF – IWM: High 2-period RSI readings in the IWM in early January helped signal a short term reversal to the downside in this ETF.
Anyone who has followed the research of Larry Connors and Cesar Alvarez knows how much we appreciate and rely on the 2-period RSI. We have gone so far as to suggest that it might be the best short term indicator available for traders, especially high probability mean reversion traders.
Click here to read more about trading using the 2-period RSI.
How do we use the 2-period RSI to spot overbought and oversold conditions? When it comes to ETFs — as opposed to stocks – we use levels very close to the standard overbought and oversold levels used by most technical analysts: over 70 signifies overbought conditions and under 30 signifies oversold conditions. The key difference is in the shortness of the tracking period — two trading days — instead of the default 14 days. Our testing has found that the shorter duration RSI does a much better job at helping detect potential short term turning points compared to the 14-day version.
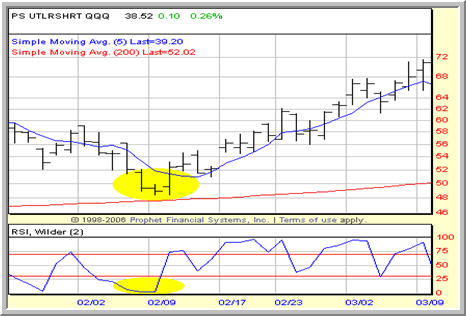
ProShares UltraShort QQQ ETF – QID: A pullback toward its 200-day moving average and plunging 2-period RSI values alerted short term ETF traders to a short term upside opportunity in QID.
Combined with the filter of the 200-day moving average (never buy below it, never sell short above it), the 2-period RSI is an invaluable tool for traders trying to spot those ETFs that have been sold too aggressively as well as those ETFs that have become overvalued and bid too high. The next time you are thinking about buying an ETF for a short term trade, take a look at its 2-period RSI and see if you are buying an ETF that is overpriced and already in high demand or an undervalued ETF that a desperate owner has (fortunately for you) put on sale.
This concludes our discussion on finding and trading overbought and oversold ETFs. And now that we know how to get into high probability ETF trades, our next series will look at strategies for closing out these trades and taking profits in a consistent, systematic manner.
According to a recent report, eight out of ten securities traded are exchange-traded funds. Want to learn how to trade them? Click here to order High Probability ETF Trading, the first quantified book of trading strategies to improve your ETF trading.
David Penn is Editor in Chief at TradingMarkets.com.