How to find stocks you can profit from
In my
recent article, I tracked the declining fortunes of the NASDAQ 100 Index
(
NDX |
Quote |
Chart |
News |
PowerRating)
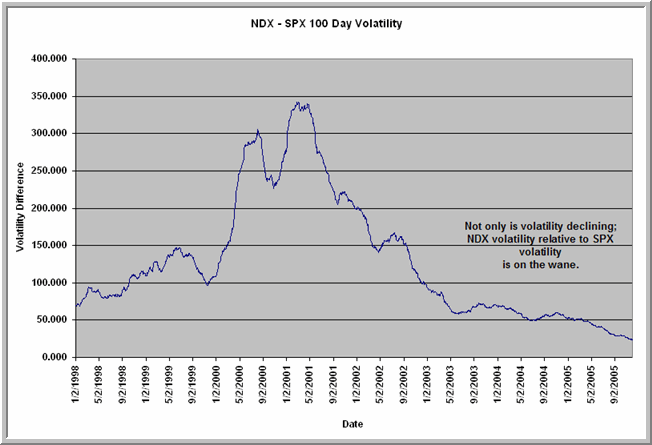
as a trading vehicle. The Index remains well below its peak price in 2000
and has steadily lost volatility relative to the Standard and Poor 500 Index
(
SPX |
Quote |
Chart |
News |
PowerRating), as the chart from that article portrayed.
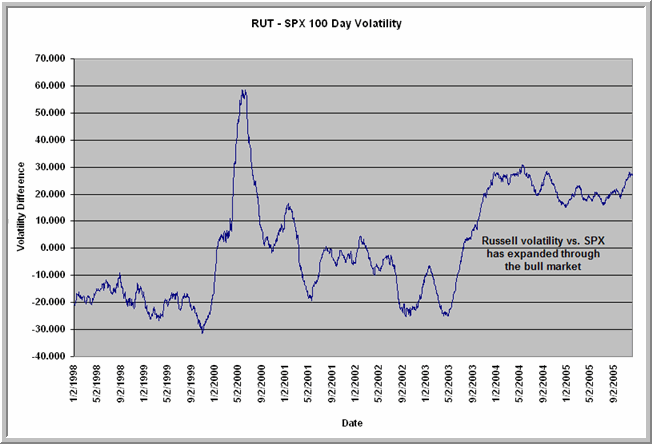
The NDX is not the only trading index to see changing fortunes
relative to the S&P 500. Below is a chart tracking Russell 2000 Index
(
RUT |
Quote |
Chart |
News |
PowerRating) volatility relative to SPX. What a difference a few years
makes! During the latest bull market that started in 2003, the Russell has
gained relative volatility as the NASDAQ has sputtered. Notice that the
Russell used to have less volatility than the S&P. Now it exceeds that
large cap index in average daily movement. Moreover, the Russell is up
38.57% since the start of 2000, and the S&P Midcap Index
(
MID |
Quote |
Chart |
News |
PowerRating)–another
relative volatility stalwart–is up 69.97%. Those compare most favorably
to the 13.46% loss by SPX and the 55.35% loss by NDX over that same
period.


In my earlier article, I mentioned the research
of Cornell University professors Charles Lee and Bhaskaran Swaminathan and their
provocative idea that stocks go through Momentum Life Cycles. They begin
their ascent as low volume issues that outperform the broad market. In
this phase, they demonstrate superior market returns several years out. As
they gain attention–and trading interest–they become high volume
winners. In this phase they are good trading vehicles, demonstrating
superior gains several months out, but ultimately reverse and become losers over
the next several years. This third phase, one in which the stocks
disappoint investors, is one in which issues are high volume losers. As
the stocks lose interest on Wall Street, they eventually become low volume
losers and display poor trading and investing potential.
The NASDAQ 100 seems to have made its turn on the momentum life
cycle, but the small cap and midcap stocks still seem to be on a rising
path. This suggests that, at the very least, they should be superior
trading vehicles. Indeed, that is what my research is finding. On my
free research site, I took a basic momentum trading strategy and found that
trading
(
SPY |
Quote |
Chart |
News |
PowerRating), the S&P 500 exchange traded fund (ETF), with the strategy
returned an average .26% over three days, more than double the index’s average
three-day gain of .12% during that July, 2003-November, 2005 period. The
midcap ETF
(
MDY |
Quote |
Chart |
News |
PowerRating), however, returned .42% with the same trading pattern.
Earlier, I found a similar result using a sentiment-based trading strategy: the midcap index extracted more profit from the strategy than did the large cap
index.
In fact, my research thus far suggests that what
you trade may be every bit as important to profitability as how
you trade. A great strategy on the wrong side of the Momentum Life Cycle
may be less profitable than an average strategy that is applied to the right
stocks, sectors, and indices. Right now, those smaller stocks and their
indices are looking like right places to be.
Brett N. Steenbarger, Ph.D. is Associate Clinical
Professor of Psychiatry and Behavioral Sciences at SUNY Upstate Medical
University in Syracuse, NY and author of The
Psychology of Trading (Wiley, 2003). As Director of Trader Development
for Kingstree Trading, LLC in Chicago, he has mentored numerous professional
traders and coordinated a training program for traders. An active trader of the
stock indexes, Brett utilizes statistically-based pattern recognition for
intraday trading. Brett does not offer commercial services to traders, but
maintains an archive of articles and a trading blog at www.brettsteenbarger.com
and a blog of market analytics at www.traderfeed.blogspot.com.
He is currently writing a book on the topics of trader development and the
enhancement of trader performance.
