How to Identify and Trade Reliable Support and Resistance
I will never forget the first time I burnt myself by pulling a pizza pan in the oven. It took me a while before I started eating pizza again.
Fortunately I learned to love pizza, and I also learned to respect hot metal objects. I was about 6 years at the time of this valuable lesson. Little did I know that this event would serve as the foundation of my trading career. Today I literally look for hot pizza zones on the charts.
A quick look at the AUD/USD chart in August of 2003 suggests that the AUD/USD also learned a valuable lesson. This currency pair learned that the 0.6340 area is a good place to pause.
Click here to order your copy of The VXX Trend Following Strategy today and be one of the very first traders to utilize these unique strategies. This guidebook will make you a better, more powerful trader.
Take a look at what happened back then.
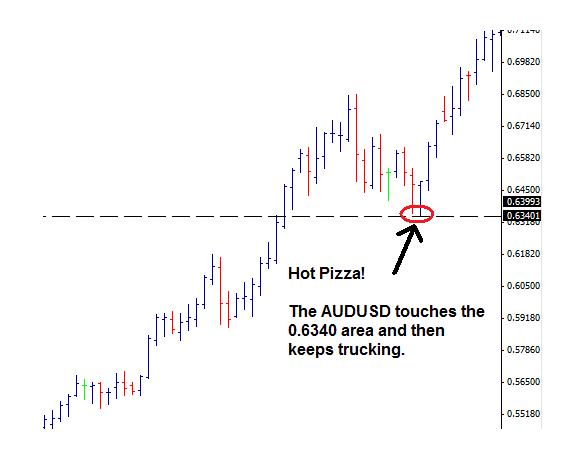
Why did this happen? Why did the AUD/USD touch the 0.6340 level and then bounce on upward?
The answer is this: the AUD/USD has a memory. The same thing happened in 1985, 1997, 1998, 1999, 2003 and then again in 2009. The AUD/USD found support or resistance at this level. The AUD/USD is just like all of the other markets, it has a memory.
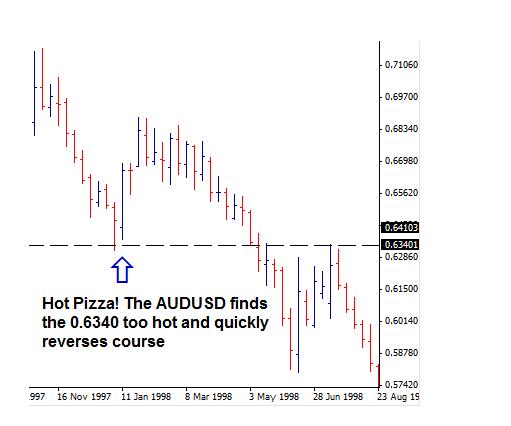
When the pair reaches an important level, like 0.6340, it will often pause at this level, and many times it will reverse course and go in the opposite direction. For example, if the AUD/USD is traveling downward, trading lower and lower, and then hits an important level such as the 0.6340 level, then it may reverse course. This is exactly what we see happen in January 1998, the 0.6340 area provides support for the AUD/USD. Like a young child with his hand on the hot pizza pan, the pair touches the 0.6340 level and then quickly pulls away.
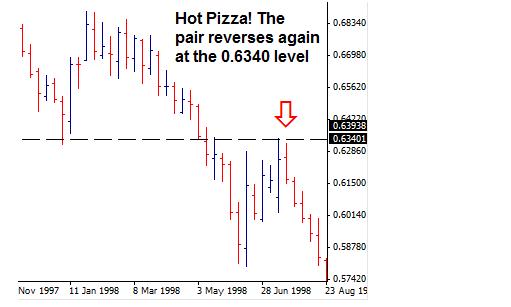
The interesting thing about these levels is that they provide both support and resistance for the currency pair. Later in 1998 we see that the 0.6340 level that provided support earlier in the year now provides resistance. The pair travels upward in June 1998 and then in July runs into resistance at 0.6340 again.
Many traders are aware of the fact that support often becomes resistance and vice versa. This means that there are many traders who will assume that once the pair reaches this area it will bounce hard away from the line. But sometimes this doesn’t happen, sometimes the pair seems to push through the support or resistance line on the chart. Why is this the case? The answer is – because the support/resistance line on the chart is a zone, not a line. There are six rules of support/resistance, and this is the first rule.
Rule 1. The support/resistance area is a zone, not a line. Expect price to reverse in this area, don’t expect price to turn on a dime. These areas may be 30-50 pips wide at times.
In general, the higher the timeframe chart you are using to draw your horizontal support/resistance lines, the greater the area of support or resistance. This simply means that a weekly chart will be likely to have a much larger support or resistance zone than a five minute chart. In any case, the important thing to remember is that the support/resistance area is a zone.
Rule 2. While we may expect price to reverse in this area, it may be best to wait for confirmation once price approaches one of these areas. I won’t assume that price will reverse here, but instead I will wait and see if that is the case.
It doesn’t matter what you use, but use something other than the support or resistance zone to confirm that the price is indeed reversing. You may use another indicator (MACD divergence), candlestick formations (bullish/bearish engulfing bars) or price patterns (double top/double bottom) to confirm that a reversal is near
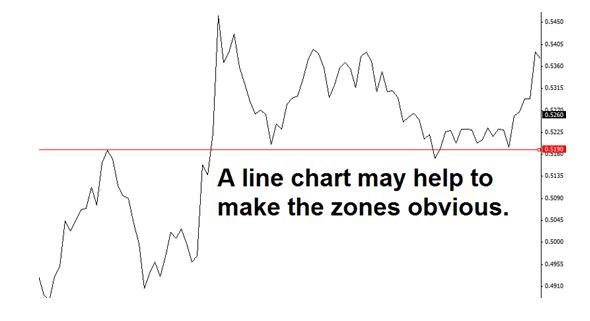
Rule 3. One simple trick that may enable you to ‘see’ these areas is to use a line chart. Most charting packages allow you to view charts with candlesticks, price bars or lines. Choose the line option and see if you can draw in the support/resistance lines yourself.
The idea is that if you concentrate on the “bends” in the chart you will easily find those places where price has found support and resistance. Sometimes candlesticks and bar charts offer too much information.
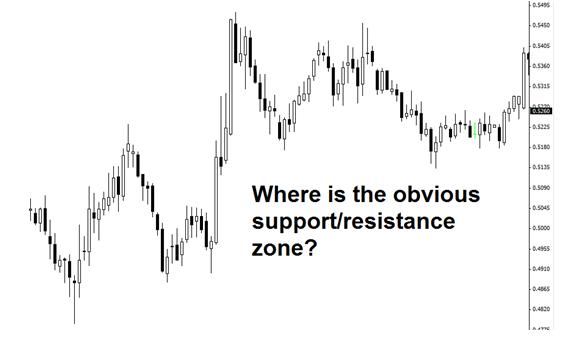
By putting up a line chart, you can easily see the bends in the chart. The spots that you are looking for are those that have been support and resistance for the pair in the past. These are the zones that you can mark on your chart for future reference.
Rule 4. To identify a support or resistance area is identified by finding an area where price has found both support and resistance. Once price has touched the zone from the top and found support and then moved upwards and price has touched the zone from the bottom and found resistance and then moved downwards, I consider the zone a valid support/resistance area.
The only real exception to this rule would be those areas where the pair has made a new high or a new low. If the pair has never before traded in an area, and then trades there and then reverses, I will consider this a support or resistance zone.
Rule 5. The really good support/resistance areas have been around for years. Like a really good wine, these zones get better with age – these ‘older’ zones are especially helpful when a currency pair has not traded in the area for years and appears to have broken out after several years in a trading range.
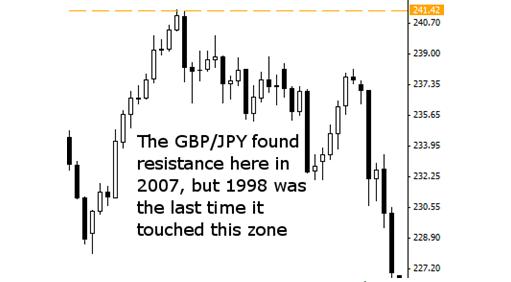
The important thing to remember is that just because a support/resistance area is an old area, you should not ignore it. On the contrary, the older support/resistance areas are often very important levels when the market goes to a place it has not been for years.
Rule 6. Pay no attention to these rules, make up your own.
I really believe that these rules will help you trade profitably. But this is because they work for me. Obviously you should find out if these rules work for you. Almost all profitable traders share a common trait – they backtest their trading strategies. Don’t take my word for it, test these rules out for yourself by manually backtesting them or by opening up a demo account to see if you can apply these rules profitably for yourself.
Walter Peters, PhD is a professional forex trader and money manager for a private forex fund. In addition, Walter is the co-founder of Fxjake.com, a resource for forex traders. Walter loves to hear from other traders, he can be reached by email at walter@fxjake.com.
Are you finding the most relevant high probability setups for your portfolio? With 30 categorized lists of promising setups, find exactly what you need to take your trading to the next level – click here.