How to identify high probability set-ups
Dave Floyd is a professional FX and stock trader based in Bend, OR and the
President of Aspen Trading Group. Dave’s approach to FX combines technical
and fundamental analysis that results in trades that fall into the swing
trading time frame of several hours to several days. For a free trial to
Dave Floyd’s Daily Forex Alerts
or call 888.484.8220 ext. 1.
In the previous two installments of this ongoing
series of FX Trading Basics I outlined the methods I use for determining the
trend (read
part I and
part II here). In today’s installment I
want to discuss, how I combine multiple time frame analysis and stochastics in
identifying high probability set-ups versus low probability set-ups.
First, some bullet points to outline my thoughts:
- Higher time frames, generally, but not always,
take precedent over lower time frames. - Stochastics, for me, are a filtering
mechanism; not a timing. mechanism.
To review, I use three primary time frames in
day-to-day analysis:
60-minute
240-minute
Daily chart
I do use a weekly chart to identify key support and resistance levels, rarely as
a timing mechanism.
Identifying the trend is simply but one piece to the puzzle, once the trend is
correctly identified, you then need to determine whether or not prices will
continue to exhibit the trend. There are many times when the trend is easily
identified, but is actually on the verge of changing trend direction. For
purposes of this article, let’s assume that the time frame that we do the
primary analysis (i.e. the time frame we will execute on) is the 60-min chart.
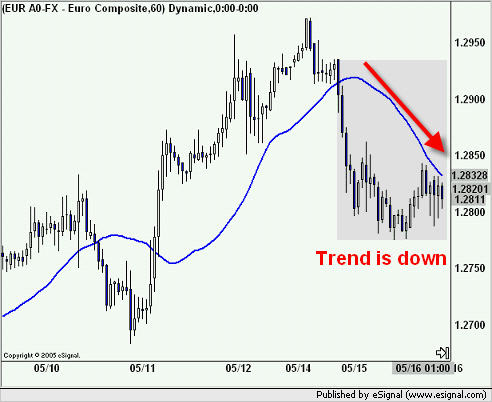
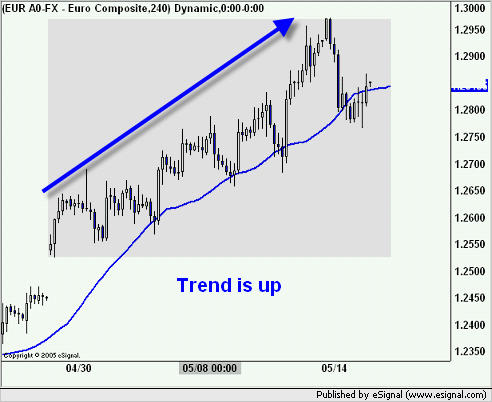
The charts below are the 60 & 240-min of EUR/USD. On each chart, the trend is
quite clear. If we then defer to bullet point # 1 above — Higher time frames,
generally, but not always, take precedent over lower time frames — we would
have to resist the temptation to short EUR/USD based on the 60-min chart.


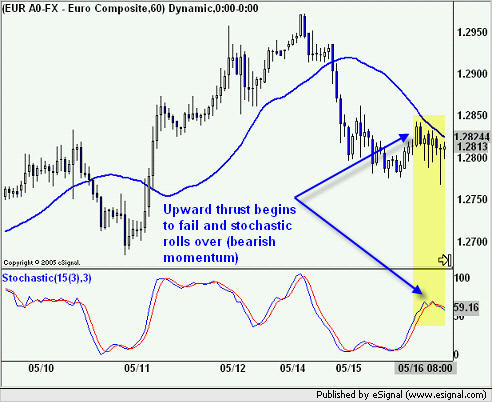
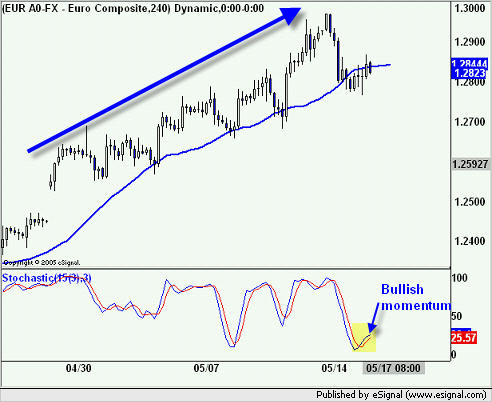
However, this simple analysis, will often lead you to miss trades. In order to
make a proper assessment, you need to add one more indicator to your chart in
order to conclusively know to not short EUR/USD based on the 60-min chart —
stochastics.

In this case, the stochastics simply confirm the conclusion we drew from looking
at the first 2 charts we posted without the stochastics. However, there are many
times when this will not be the case.

In the next installment, I will provide several examples of how to properly use
stochastics and inflection points in order to properly identify high probability
trade entries.
- I will be appearing on CNBC World’s
Foreign Exchange
on Wednesday at 5:30 AM PDT to discuss the FX markets. - Launch Aspen Trading Group’s
FX Desktop Ticker
for real-time FX trade alerts and commentary
As always, feel free to send me your comments and
questions.
Aspen Trading Group
