How To Improve Your Market Timing With Sequence Trading
Kevin Haggerty is
the former head of trading for Fidelity Capital Markets. His column is intended
for more advanced traders. If you would like to learn how Kevin trades,
you can find more information here.
Friday, Aug. 5, 2005, was the 1.618 Fibonacci
(
SPY |
Quote |
Chart |
News |
PowerRating)/
(
DIA |
Quote |
Chart |
News |
PowerRating) time ratio measured in trading days from the 10/25/04 low to
the 04/20/05 low. Also, the intraday high last week was 1245.86 on Wednesday,
Aug. 3. This is into the 1254 .618 retracement zone to 1553 from the October
2002 769 low. The other anticipated sequence was that the SPX
(
SPX |
Quote |
Chart |
News |
PowerRating)/SPY had reached the nine-month extended +2.0 standard deviation
level. This is the kind of sequence that usually results in a reversal of the
current trend, or else accelerates through a key price zone after a short
pullback. In this case, the SPX has been trending up from the SPX 1183.55
07/07/05 London low without any kind of pullback (see 08/01 commentary
“The Next
Important SPY Time Date Approaching”). This is a key part of my methodology that
is used equally as well in swing trading and longer-term trading, as well as daytrading. It is also applied to all markets, including FOREX.
The SPX was -0.8% to 1226.42 on Friday and -0.6%
on the week with a new bull cycle 1245.86 intraday high. The Dow was -0.5% to 10,558 and -0.8% for the week. The Nasdaq
(
COMPQ |
Quote |
Chart |
News |
PowerRating) was -0.6%
to 2178 and the
(
QQQQ |
Quote |
Chart |
News |
PowerRating) 39.48, -0.5%. They were -0.4% and -0.3% on the week.
NYSE volume was 1.47 billion shares with a volume ratio of 22 following
Thursday’s volume ratio at 27. Breadth was -1792. The up volume/down volume
weekly ratio was negative for the first time in the past five weeks at .82.
Breadth was also net minus on the week at -1670, which was also the first week
of five to go minus.
The 08/03/05 commentary
“This is not Money
Managers’ Favorite Theme” was front and center last week. The un-favorite theme
is crude oil, gold and interest rates rising with the US Dollar declining, and
that is what we got last week. Crude closed up 62.31, the $XAU +4.5% on the
week,
(
OIH |
Quote |
Chart |
News |
PowerRating) +2.4% and the
(
TLT |
Quote |
Chart |
News |
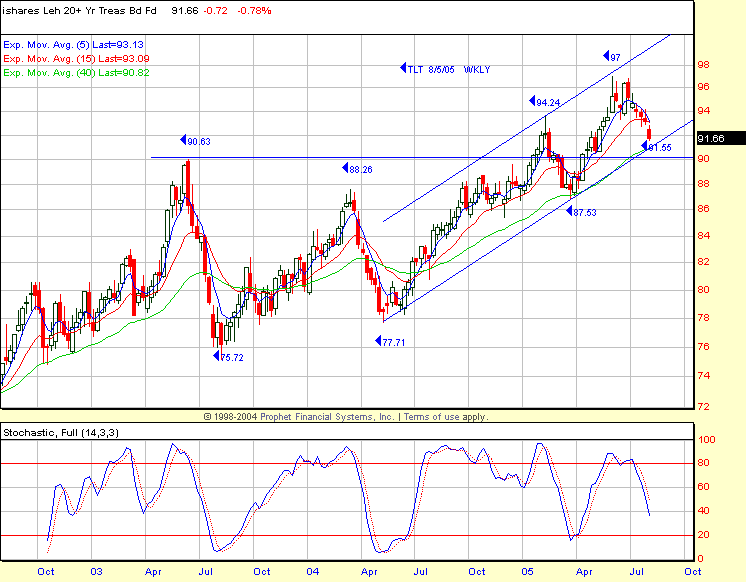
PowerRating) -1.2% on the week to 91.66 and -0.8% on
Friday. The US Dollar index ($USD), which has been declining from the 90 – 92
resistance zone, closed at 88.03 after making an 87.70 intraday low. The
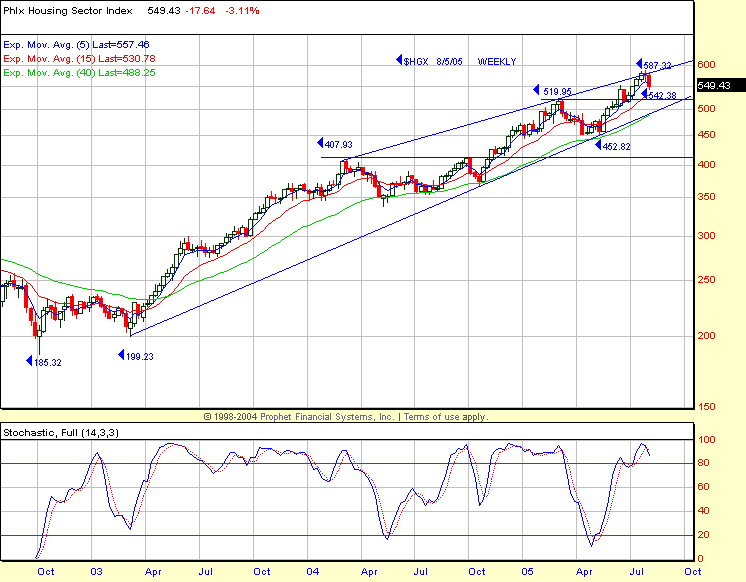
interest rate rise is in conjunction with the $HGX (housing index) which was
-3.1% on Friday, declining from a rising wedge high of 587.32 on 07/29 to a
542.38 low and 549.43 close on Friday. The $HGX current up trend from the last
retracement to 452.82 was 11 weeks into the 587.32 high (see chart).
This theme is a pricing combination that gives
you much market insight into the timing of the very end of this bull cycle.
Have a good trading day,
Kevin Haggerty
P.S. I will be referring to charts at www.thechartstore in the future.


