How to Leverage Your Trading Dollars with Ultra ETFs, Part 2
Let’s face it. As traders, all of us at one time or another has spotted a sector roaring higher-and then bought the only stock in that sector that decided to sleep through the entire party. Or, we decide technology stocks are a great place to be, and we scoop of shares of ^AAPL^, ^RIMM^ and ^BIDU^. That might be the day that an analyst decides that BIDU is too pricey . . . and downgrades it . . . thus sending shares of the Chinese Internet stock lower.
An easy solution-especially if you don’t feel like researching additional tech stocks–is to fire BIDU and replace it with shares of the tech-heavy ^QLD^. As long as the NASDAQ 100 index is moving higher, the QLD should be able to keep up with-or even outpace-your other tech holdings.
In the chart below, you see a 5-minute intraday chart of the QLD and BIDU. The QLD is plotted showing candlesticks; BIDU is represented by a line (closing price of each bar). The volume shown belongs to the QLD.) Notice how, on a day when the QLD drifted higher until early afternoon, BIDU slid south. Midday, both the QLD and BIDU fell, executing a nice head fake (and no doubt stopping out a lot of traders). In the early afternoon, though, the QLD shot higher, tracking the NASDAQ 100’s climb. Poor BIDU could barely climb off of its lows.
^QLD^ & ^BIDU^ 5-Minute Chart

RealTick graphics used with permission of Townsend Analytics, Ltd. 1986-2008 Townsend Analytics, Ltd.
The strategy on this day–especially in the afternoon session– was clear: keep BIDU to one side, and let the QLD take its place.
Using Ultra ETFs for Short Term Plays
Currently, the market is taking traders on the ultimate roller coaster ride. In this type of uncertain market environment, I limit my trades to intraday time frames. Or, if I do hold an overnight position, I hold it for one night, only.
Again, Ultra MarketCap ETFs provide a great vehicle for popping in and out of volatile markets. As long as you’re on the right side of the trade, Ultras will hand you a double bang for your buck.
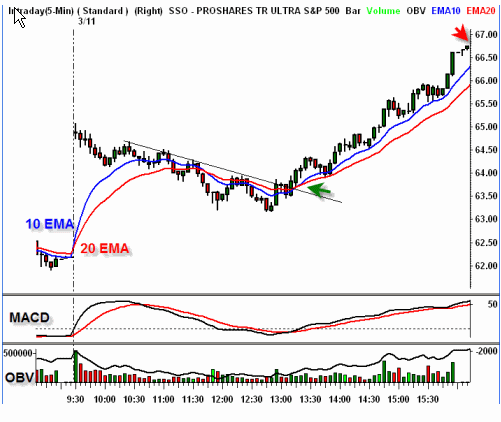
On March 11th, the S&P 500 Index gapped open to the upside, then drifted down all morning, trying to fill the price gap. At about 1:30 p.m., however, the bulls took charge and the S&P flew steadily higher, all the way to the closing bell.
The 5-minute chart shown below shows the price action of the ^SSO^. Although I had no intention of holding shares of this, or any other stock/ETF overnight in this market environment, it was a clear shot to buy shares of the SSO when the S&P shot higher, breaking above its downward drift. When the SSO’s 10-period EMA (exponential moving average) crossed above its 20 EMA and volume increased, I took the buy signal (green arrow) and bought shares of the SSO at 64.

RealTick graphics used with permission of Townsend Analytics, Ltd. 1986-2008 Townsend Analytics, Ltd.
The rest of the ride was easy, as the SSO naturally moved higher with the S&P 500 for the remainder of the afternoon. Just before the bell, we exited at 66.50. It was a dandy, stress-free trade, and we took home 2.50 per share profit.
Please note: when trading any of the Ultra MarketCap ETFs, be sure to watch the actual index -not the ETF-to make entry and exit decisions. Especially because of their leveraged status (which creates wide daily trading ranges), these ETFs can shoot up and down very fast. So, be sure to use the correlating index, such as the Dow Jones Industrial Average, S&P 500 index, NASDAQ 100 index, and so forth, as leading indicators for the ETFs. For day trading purposes, you may want to use the E-mini futures to act as your leading indicator.
Novices: please paper trade the Ultras until you become comfortable with their sometimes volatile price action.
As you can see, when used wisely and with caution, ProShares Ultra ETFs are a powerful trading tool that can help boost your trading profits in both the short and long term.
In my next installment, we’ll continue our discussion of a different family of exchange traded funds. Until then, keep green on your screen, and here’s to your good wealth!
You can find more how-to and educational articles to improve your investing and trading each day on TradingMarkets.com.
Toni Turner is a trader and investor with seventeen years of experience in the financial markets. She is the best-selling author of A Beginner’s Guide to Day Trading Online 2nd Edition, A Beginner’s Guide to Short Term Trading and Short-Term Trading in the New Stock Market. Toni has appeared on NBC, MSNBC, CNN, and CNBC. She has been interviewed on dozens of radio programs and featured in periodicals such as Fortune magazine, Stocks and Commodities, SFO, MarketWatch, Fidelity Active Trader, and Bloomberg Personal Finance.
Toni is the President of TrendStar Group, Inc. For more information about her live and online seminars, as well as additional educational products, please go to www.ToniTurner.com
