How to play the bull market in China
Strength in the tech stocks helped
the Nasdaq to break out to finish at its highest level since February 2001, but
the S&P and Dow lagged behind. A 1.6% gain in the Semiconductor Index
($SOX) enabled the Nasdaq Composite to close 0.7% higher. The S&P 500 advanced
0.3%, while both the Dow Jones Industrial Average and S&P Midcap 400 indices
gained 0.2%. The small-cap Russell 2000 rallied 0.4%. The S&P and Dow both
closed near the middle of their intraday ranges, but the Nasdaq wrapped up the
session near its high.
Total volume in the Nasdaq increased by 3% over the previous
day’s level, enabling the index to register a bullish “accumulation day.”
Turnover in the NYSE was unchanged. Although it’s positive that the Nasdaq
gained on higher volume, the increase was not enough to push volume back above
its 50-day average level. This tells us that yesterday’s gain was more the
result of an absence of selling as opposed to a large presence of institutional
buying. In the Nasdaq, advancing volume exceeded declining volume by a healthy
margin of 2.3 to 1, but the ratio in the NYSE was positive by only 1.3 to 1.
In yesterday’s newsletter, we illustrated the “head and
shoulders” pattern that was setting up on the hourly charts of both the Nasdaq
Composite and Nasdaq 100 indices. But the right shoulders never fully
materialized and both Nasdaq indices instead rallied above the top of their
“heads,” thereby invalidating the chart pattern. As such, all bets are off on a
short-term downward move in either Nasdaq index. The S&P 500, however, still
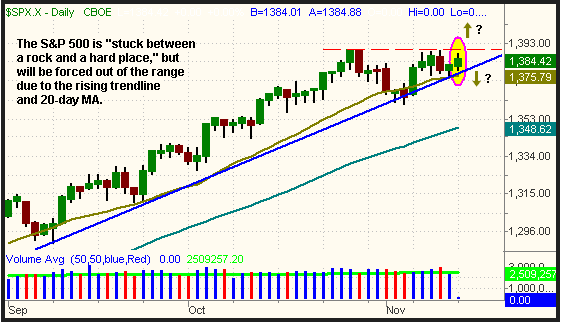
remains below its prior high of 1,389. As you can see on the daily chart below,
the index has attempted to break out on several occasions over the past week,
but has been unable to do so. With both the 20-day moving average and the lower
channel of its primary uptrend line quickly closing in, we should see a decisive
move out of the range, one way or the other, within the next day or two:

Though the major indices have been grinding higher lately,
they have been doing so in a choppy and indecisive manner that has lacked
momentum. It’s the kind of market that makes it challenging for trend-traders
who thrive on market momentum. One of the reasons for the chop has been the
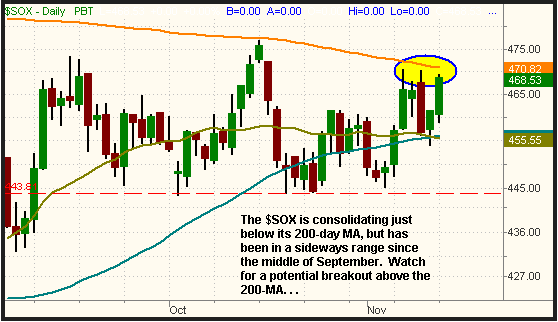
range-bound performance of the $SOX index. Over the past two months, the $SOX
has been oscillating in a horizontal range of seven percent. The good news is
that the moving averages have converging in such a way that should soon force
resolution out of the range. Just below yesterday’s low, the 20 and 50-day
moving averages have converged at the 455 level. Overhead resistance of the
200-day moving average is right over yesterday’s high, but the $SOX has stalled
just shy of its 200-day MA on several occasions over the past month. Still, the
longer it consolidates just below the resistance, the more likely it will
eventually break out above the range. Keep a watchful eye on the $SOX in the
coming days, as it always acts as a reliable leading indicator for the direction
of the Nasdaq and the whole broad market:

In the event the S&P 500 begins to roll over by falling below
its uptrend line, look for the Retail Index ($RLX) to be among the weakest
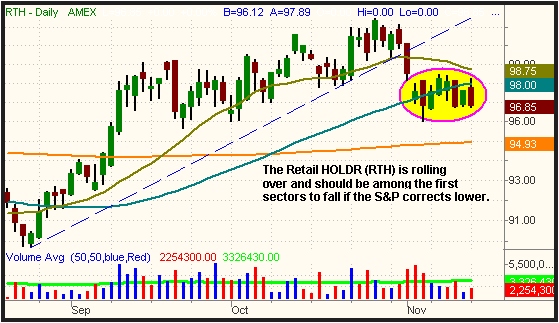
sectors. To illustrate the recent relative weakness in Retail, take a look at
the daily chart of the Retail HOLDR (RTH):

RTH was looking good until November 1, when it broke support
of its tight consolidation and fell below its primary uptrend line. Two days
later, RTH closed below its 50-day moving average. Over the past week, it has
attempted to rally back above its 50-day MA, but it has lacked the momentum to
do so. This relative weakness to the broad market tells us that RTH is a good
short sale candidate if the S&P fails to break out to a new high.
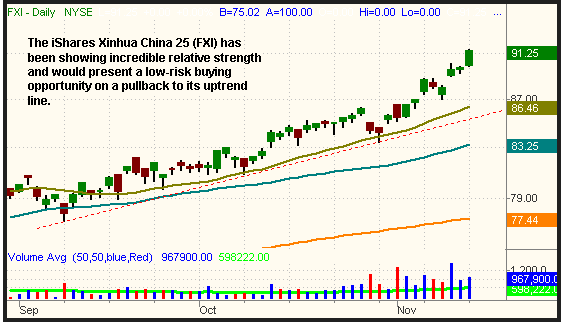
Conversely, the iShares Xinhua China 25 Fund (FXI) has been
one of the strongest ETFs of the past week.

Tracking mainland China’s equivalent of the Dow Jones, FXI has
been completely ignoring the sideways action in the S&P by rallying steadily
higher. Yesterday, it closed at a fresh all-time high for the third consecutive
day. It’s pretty far away from its 20-day moving average right now, so buying at
current levels may not carry a positive risk/reward ratio. However, we
definitely like the idea of buying it on a pullback to support of its uptrend
line. If the broad market continues higher from here, we may not see a decent
correction in FXI for a while, but a solid pullback in the S&P should lead to a
low-risk entry point in FXI.
Open ETF positions:
Long GLD, USO, DBC, short ICF (regular subscribers to
The Wagner Daily receive detailed stop and target prices on open
positions and detailed setup information on new ETF trade entry prices. Intraday
e-mail alerts are also sent as needed.)
Deron Wagner is the head trader
of Morpheus Capital Hedge Fund and founder of Morpheus Trading Group (morpheustrading.com),
which he launched in 2001. Wagner appears on his best-selling video, Sector
Trading Strategies (Marketplace Books, June 2002), and is co-author of both The
Long-Term Day Trader (Career Press, April 2000) and The After-Hours Trader
(McGraw Hill, August 2000). Past television appearances include CNBC, ABC, and
Yahoo! FinanceVision. He is also a frequent guest speaker at various trading and
financial conferences around the world. For a free trial to the full version of
The Wagner Daily or to learn about Deron’s other services, visit
morpheustrading.com
or send an e-mail to
deron@morpheustrading.com .
