How To Play Them And When
After
yesterday’s trading, there is no new change in direction,
as the SPX
(
$SPX.X |
Quote |
Chart |
News |
PowerRating) closed in the
bottom of the range at 827.55, and -1.3% for the day. The intraday low was
826.68. The Dow
(
$INDU |
Quote |
Chart |
News |
PowerRating) was also off -1.3%.
The SPX can’t get past
the 20-day EMA after bumping up against it for five straight days prior to the
last two days. That didn’t prevent traders from having a positive day yesterday,
and based on the e-mails, obviously many of you did. It started with our
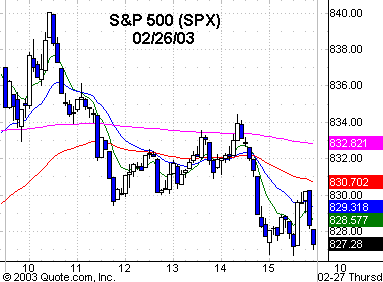
favorite Trap Door on the five-bar decline to the 60-minute 20 EMA with an entry
on the re-cross to the upside. This trade only ran about 7 points where it
barely took out the previous day’s high of 839.55, which is also the .618
retracement between 954.28 and the October low of 768.69.
The SPX hit the intraday
high of 840.10 on this Trap Door contra move, then reversed the 839.55 high.
This was a 1,2,3 higher top short entry using both the late-Tuesday uptrend and
then the breaking of the logical trendline on the initial decline to a Trap Door
yesterday. This trade never looked back after reversing 839.55, as it traded
down to the 827.55 close. The countdown appears to be on for Iraq, and the news
volatility will only increase, so daytraders will have many opportunities, and
money managers will be reducing their portfolio exposure by selling futures.
Overall, NYSE volume was
1.33 billion, a volume ratio of 34, and breadth -850. I only give you these same
three numbers every day so you can keep a record of the relationships between
price, volume and breadth. I have them back many years and know exactly what the
numbers look like at every turning point, both minor and major. You either do
the work yourself so you are working and making decisions based on fact and not
listening to some empty suit making subjective opinions based on some technical
analysis textbook that was outdated as soon as the equity futures entered the
picture, along with many other derivatives. Many of the classical patterns are,
of course, very solid, but it is the “how to play them and when” that has
changed. The Nasdaq
(
$COMPQ |
Quote |
Chart |
News |
PowerRating) lost 1.9% and the NDX
(
$NDX.X |
Quote |
Chart |
News |
PowerRating) -2.5%.
INTC and MSFT were key components of that red day, as were some other semis. The
(
SMH |
Quote |
Chart |
News |
PowerRating)s declined 3.2%.
We start today with the
SPX right at a triple bottom on the five-minute chart, having closed at 827.55,
so you are on alert for the futures weasels to take out that triple bottom,
which may set up an initial reversal trade, but that low then becomes your
downside short pivot if the reversal up fails. Be sure to lock in profits
quickly if you play the reversal, if that in fact, is what happens.
It’s the market’s move
right now, not ours. I say that because it’s right in the middle of the +5.8%
move from the .786 zone of 808 to 853. Somebody asked me the other day on a
conference call whether I had an opinion for the next day, and my answer was no,
but I had a trading plan. I highly suggest you all do the same.
Have a good trading day.

Five-minute chart of
Wednesday’s SPX with 8-, 20-,
60- and 260-period
EMAs

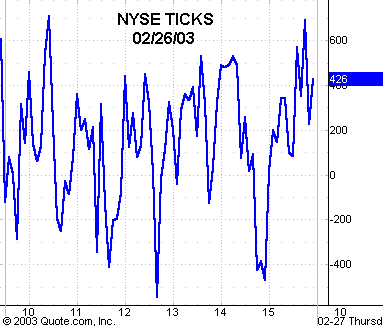
Five-minute chart of
Wednesday’s NYSE TICKS
