How to Properly Test Your Strategies
Thank you to everyone who sent in their test results. I won’t be able to answer you directly as too many were submitted. But I’ll share with you the actual test results and then discuss why a few people had different answers.
The test I asked you to run was as follows:
For those of you who enjoy back testing, or for those of you who are just learning how to back test, I’m going to give you a simple test to run over the weekend. What I’d like you to do is
Run the following test and send me the test results by Sunday night. This includes the number of trades, the % correct and the avg. gain per trade.
Here is the test. You’ll test this on the SPY going back to January 1993.
The SPY is above the 200 day ma.
If the 2 period RSI closes under 25 two days in a row, buy 10% of a position on the close of that second day of the RSI under 25.
If at anytime you’re in the position, and it closes lower than your original buy price, buy 20% more
If at anytime you’re in the position and it closes lower than your previous buy position (the 20% position) buy 30% more.
If at anytime you’re in the position and it closes lower than your previous buy position (the 30% position) buy 40% more getting you to a full position.
The exit is on the close anytime the 2-period RSI closes above 70.
When you send me your test results, also send me your trading platform you tested this on and the data source that the platform used.
There are two great reasons to do this test.
You’ll get a chance to practice testing TPS scale-ins
As a whole, my strong guess is that there will be many different test results sent to me based upon the platform used and the data sources used. From there, I will be able to tell you whether the integrity of your code and data is correct and what you can do to improve upon it.
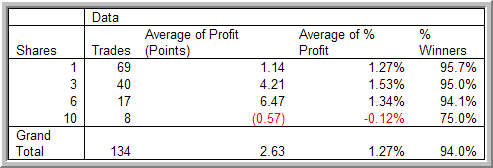
Here are the results:

As you can see, 94% of the trades going back to 1993 through a few days ago have been profitable in the testing (an extraordinary number). The average gain per trade was 1.27% with only 8 trades getting to a full position.
If you got the same results, great job and congratulations!
If you got different results, here are some of the possible reasons.
You used data that had integrity issues. Without naming any specific companies we don’t use, I’ll tell you we use CSI data as we find it is the most reliable. We ran this test on the data from other platforms and data vendors and the results were not the same (they were wrong). This is a major issue with the industry and if you’re going to rely upon your tested strategies to trade, make sure you are using the best available data.
Check your code. It’s very easy to make coding errors, especially with a scaling-in process. We use Amibroker for much of our testing. We can choose any testing platform we like and have used many. Amibroker is the most reliable.
Did you continue to scale-in on the times the position closed under the 200 day ma? Look at the rules. It states to buy above the 200-day. If the SPY broke under the 200-day, there was no further scale-ins. Easy mistake. But it will change your results.
The test I had you run is a fairly simple test. Yet I received results that were in many cases correct and in other cases not correct. The integrity of your testing plays a key role in deciding whether or not you should be trading the strategy. Obviously TPS is a superior ETF strategy as shown above and as many of you have learned from our book High Probability ETF Trading , our courses and also in our High Probability Software. Knowing the test results ahead of time doesn’t guarantee success but it does give you a good guideline as to how the strategy has performed in the past (in this case over 1 1/2 decades), especially high probability trading strategies like TPS.
I hope this has been a helpful exercise for you. If you’d like to receive the historical results on most of the major ETFs along with all the daily High Probability ETF Trading set-ups each day, take a free trial to our High Probability Web Based Software and/or our High Probability ETF Alerts.
You can take your free trial by calling toll free 1-888-484-8228 ext. 1 or 213-955-5858 ext. 1.
Larry Connors is CEO and Founder of TradingMarkets.com and Connors Research.
