How to Properly Trade a Range Bound Instrument, Part 1
There are truly only two ways a price can move, either up or down. However, when gauging trends in the market, there is a third way in which the trend can move. This direction is sideways which can also be referred to as a flat or range bound trend. This type of trend occurs when the overall price does not make much of a move in either direction, and often is bound between two price levels. Although it is obvious how to profit from an up trending or down trending market, it is not as apparent how a trader can take advantage of a sideways market.
Below is an example of a sideways trending market that is displayed on the GBP/USD currency pair.
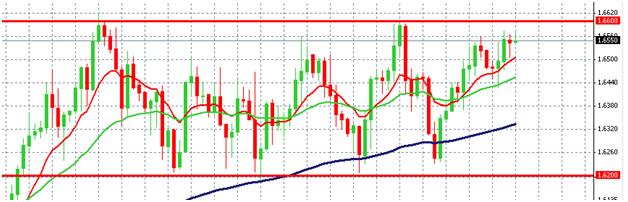
The pair has been trading between the 1.6200 and 1.6600 price levels and has displayed a strong reaction to both bounds of the range. Although this type of price action does not tend to be the most exciting, it can often lead to a profitable trading environment for traders who are patient and disciplined enough to recognize the opportunity.
The first step in creating a trading system for a range bound price is to examine the actual strength of each bound. Although both bounds often appear similar, more often than not they exhibit distinct and unique characteristic that a trader needs to evaluate before entering any position. To identify and quantify each bound a trader should use the following four statistics: frequency, range, reaction time, and strength.
The first quality, frequency, is the measure of how often the price approaches each specific bound. This should be used as a relative comparison between the two bounds and is a continuously changing statistic. To find the current frequency, you need to count each specific instance where the price reacted to a specific bound.
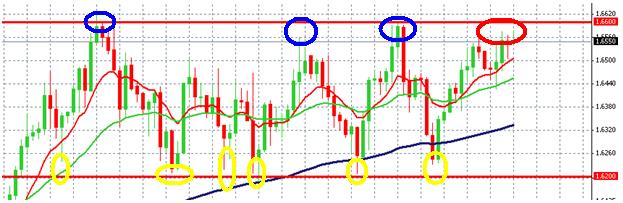
In this specific case we can see the lower bound displays a higher frequency with 6 instances compared to 3 instances for the upper bound (the red circle has not proven to be a reaction zone yet). This tells us that the price has had a higher tendency to trade towards our lower bound and indicates that we will have a greater amount of trade signals from the lower bound. This is a vital piece of information because it not only helps us manage our expectation of future price behavior, but it also helps define our trade management strategy for this particular setup. This topic will be covered in greater detail in a later part of this series.
At this point you probably have noticed in this chart that the price’s distance from each bound can vary greatly. These variations in the distance are the second statistic will be used to evaluate our system.
Range is the measure of the area of effect that each bound displays. This measurement is a range in which the price has shown to react to a particular bound. Often this measure can differ greatly between the two bounds, however this in not the case for our example.
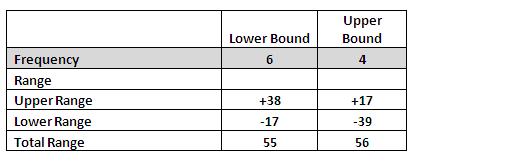
The zone for each bound is formed by the highest and lowest points where the bound has had an apparent effect on the price of the currency pair. In some cases however, it is wise to eliminate extreme outliers as they distort the true value of the actual range. With this example there appears to be no extreme outliers, and based on the lines we have drawn, we can see the lower bound has an approximate range of +38 points above 1.6200 and -17 points below, a total range of 55. The upper bound has a similar distribution with the upper limit +17 points above 1.6000 and the lower limit -39 points below, a total range of 56.
Once you have computed and determined the range, you can start working on the last two statistics, reaction time and strength. These will covered in the second part of this article, along with an introduction on how to develop a unique trading strategy based upon these statistics.
Summary of Statistics
In the second part of this article, Matthew Cherry gives an introduction on how to develop a unique trading strategy to trade sideways markets. To read, click here Part 2.
Matthew Cherry is a market analyst for TradersChoiceFX.com. Many more of his latest articles can be found on the TradersChoiceFX Forex Blog. You can download a free Metatrader Practice Account from TradersChoiceFX and get instant access to a special report that will teach you how to use a Forex bonus program to improve your success as an FX trader.