How to put information behind your trades
I came into this past expiration Friday with
several pieces of information to help me frame trade setups. The first bit of
information came from
Jason
Goepfert‘s excellent
SentimenTrader service, which
pointed out that we could expect range bound trade on an expiration Friday. My
own data analysis confirmed this perspective, suggesting strong odds of testing
the previous day’s average trading price.
A second piece of information came from the Odds
Maker module of Trade Ideas. The
combination of Odds Maker and Trade Ideas not only scans the market for trade
setups that you define, but actually tells you how profitable those setups would
have been, had you traded them over the past three weeks. One of the patterns
that had caught my eye was opening range breakouts. Over the previous three
weeks, traders made money by fading upside breakouts of the S&P 500 Index (SPY)
30-minute opening range and then exiting the trade after 30 minutes.
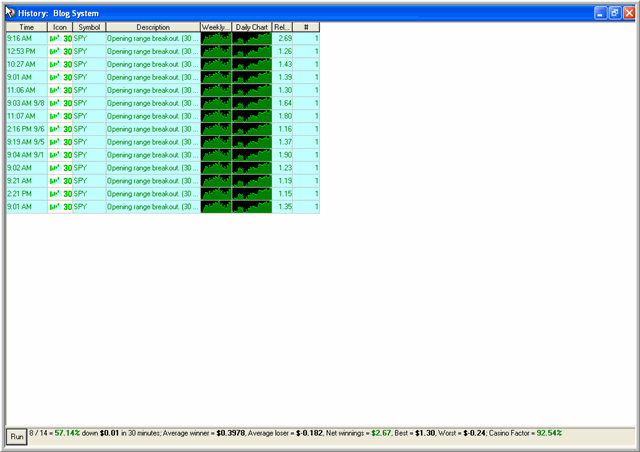
The Odds Maker printout appears below. Note the
performance stats at the bottom. Fading moves above the 30-minute opening range
was profitable on 8 of the last 14 occasions, with the average win size (about
$.40) handily exceeding the average loss (about -$.18). Net profits (before
slippage and commission) came to $2.67 per share or a little over $1300 for a
trader of 500 shares (the equivalent of a one lot in the ES minis). The best
trade made far more money than the worst trade, with the worst trade losing only
about 2-1/2 ES points and the best trade making about 13 points.

The S&P 500 Index (SPY) was quite
strong before the open, but pulled back around the open. At 9:16 AM CT, Odds
Maker sent out an alert that we had a break above the 30-minute opening range.
My next step was to draw upon further information to see if volume was going in
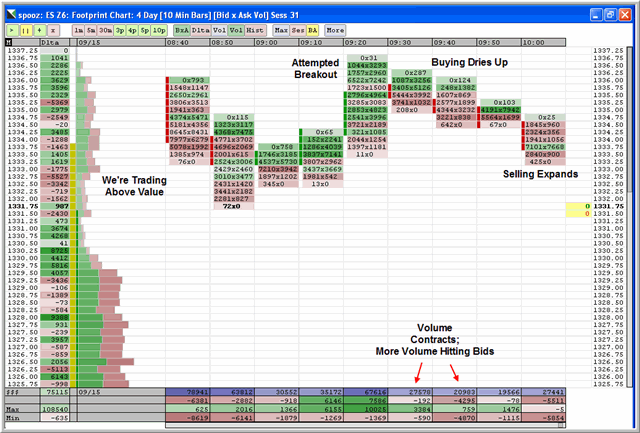
the direction of the breakout or against it. Below is the chart I followed from
the new version of Market Delta.

Notice that, after the attempted
breakout, buying dried up. The numbers in the 9:20 AM CT Market Delta bar show
over 7200 contracts traded at the market’s offer price at 1336 and about 3000
contracts traded at the offer for the next two price levels above that. When we
look at the next bar, labeled 9:30, we see that the market could only facilitate
a little over 3000 contracts at 1336 and barely anything more above that. In
the following bar, a mere 124 lots traded at 1336 and nothing above. Clearly,
analyzing the flow of volume horizontally from bar to bar, we see waning
interest among buyers.
This set up a very nice trade. We
already had the setup from Trade Ideas, and subsequent market tape action
confirmed the trade idea. By holding on for the recommended 30 minutes, it
wasn’t hard to take a full point out of the trade. My own research suggested
high odds of hitting the midpoint of the morning’s trading range, which was
achieved a little after the 30 minute holding period when we hit 1333.25. An
even longer-term hold might have been suggested by Market Profile theory,
which–given the reversal of the move above value (i.e., above the region where
we had printed most volume)–would lead one to expect a move back into the value
range.
My point is not to sell you on Odds
Maker or Market Delta. I am not employed by either firm; nor did anyone at
those firms solicit this article. Rather, I use these programs in my own
trading and to update traders in real time about emerging trading patterns
on my blog. They provide information above and beyond the usual charting
applications; that helps traders frame high probability trades that take a
minimum of heat. With enhanced decision support, I find that trading is a
three-step process:
1) Identify high probability
setups;
2) Track volume flows at the entry
signal and immediately afterward to ensure that the setup is setting up
properly;
3) Monitor volume flows during the
trade to ensure that trade idea is following through.
Grounding trading in tested ideas
and solid readings of actual volume flows is, for me, the best aid to trading
psychology of all. It is difficult for me to have confidence in ideas that have
not been tested and trades that do not follow the flow of buying and selling
from the market’s largest participants. Money manager Barry Ritholtz
recently asked his blog readers, ” What have you done to qualify or test
your trading or investing strategy?” Tracking your own trading results and
testing ideas in advance of the trade may provide the most important information
of all: the degree to which your results are due to factors other than chance.
Brett N. Steenbarger, Ph.D. is
Associate Clinical Professor of Psychiatry and Behavioral Sciences at SUNY
Upstate Medical University in Syracuse, NY and author of
The Psychology of Trading (Wiley, 2003). As Director of Trader
Development for Kingstree Trading, LLC in Chicago, he has mentored numerous
professional traders and coordinated a training program for traders. An active
trader of the stock indexes, Brett utilizes statistically-based pattern
recognition for intraday trading. Brett does not offer commercial services to
traders, but maintains an archive of articles and a trading blog at
www.brettsteenbarger.com and a
blog of market analytics at
www.traderfeed.blogspot.com. His book, Enhancing Trader Performance,
is due for publication this fall (Wiley).
