How To Read Volume In A Bear Market
The
buyers left the game again yesterday,
as the overall NYSE volume was 1.2
billion, a volume ratio of just 13, with 983 million down and just 144 million
up. Breadth was -900. The Dow
(
$INDU |
Quote |
Chart |
News |
PowerRating) finished -1.7%, the SPX
(
$SPX.X |
Quote |
Chart |
News |
PowerRating) -1.5%, NDX
(
$NDX.X |
Quote |
Chart |
News |
PowerRating) -0.8%, and the
(
SMH |
Quote |
Chart |
News |
PowerRating) -1.06%.
Over the past 10 days,
the
(
SPY |
Quote |
Chart |
News |
PowerRating) has closed down six times and up four. The average volume for the
SPY on down days was 34 million and on the up days 54 million. In a bull market,
that is positive, but in a bear market, it is not the same. When the Generals
walk away, price falls easily, and hedge funds can manipulate price down with
married puts because not much volume is needed to move price. Specialists like
to buy or sell with the Generals and will only take the minimum amount of shares
required by the NYSE when a stock is declining on lighter volume, unless they
are covering a short or they see a large buyer coming in at a certain level.
When I see the SPY down
1.7% on just 31 million shares yesterday, and the SPX closing below the 1.0
volatility band at 822, I am on alert for a possible air pocket, especially as
the situation gets tighter in Iraq. Actually, I like air pockets, both up and
down, as a daytrader, especially around the open because the specialists will
maximize price in either direction based on the early retail flow and the
partial institutional flow that they get on the open. That’s where they make the
biggest percentage of their trading profits.
The other aspect of
lighter volume on the downside in a bear market is that the reflex rallies are
very sharp due to short covering and the Generals picking a level to get
involved in on the buy side, along with the program traders initiating trades by
buying futures if they sense that both the hedge funds are covering stock and
they see the Generals leaning to the buy side. You should pay attention to the
key stocks in both the S&P 500 and NDX 100. Both indexes are capitalization
weighted, so for the NDX 100, I am sure to have MSFT, INTC, QCOM and CSCO on my
screen, and for the S&P 500, GE, MSFT, CSCO and WMT. You should also have a
market page that includes more of the top-weighted stocks in each of those key
indices. Do the same for the actively traded HOLDRs.
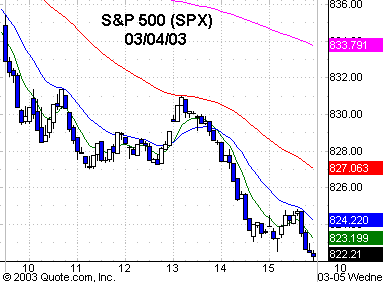
The SPX traded down right
from the opening bell yesterday until it formed a 24-bar Slim Jim on your
five-minute chart between 827.84 and 826.93. See yesterday’s commentary on the
827 level. The breakout to the upside was brief, only hitting 831, before a
pattern-failure move to the downside below 826.93, which hit an intraday low of
821.96, closing at 822, which was just below the 1.0 volatility band. That close
sets up a run at the previous magnet low of 818.54, which occurred on Feb. 25.
That also puts us back in a reversal strategy mode both ways around this 818.54
low, just as we were yesterday at a higher level.
Have a good trading day.

Five-minute chart of
Tuesday’s SPX with 8-, 20-,
60- and 260-period
EMAs

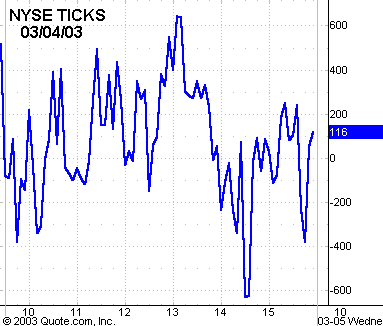
Five-minute chart of
Tuesday’s NYSE TICKS
