How To Relate The Derivatives To The SPX Cash
The
last day of the quarter was an air pocket day,
but this is something you should have
been ready for based on the world situation. I quote, “The potential for
negative news near term certainly far outweighs the positive, and if you think
otherwise, good luck on your mission.” Source: See my
March 25 commentary titled “The Profit Side of the Equation.” In this
commentary, I also said to money managers that buying weakness and selling
strength remains the profit side of the equation until shown otherwise. By
selling strength, I mean retracements to declining longer-term moving averages
and to extended volatility/standard deviation bands. I don’t mean, for example,
shorting a breakout on volume from a longer-term flat base, so please, no
e-mails.
This recent volatility in
both directions from the 789 low has provided a windfall for the synthetic
straddle, and the position is now flat and happy. The Iraq news has pumped the
(
TLT |
Quote |
Chart |
News |
PowerRating)s, which is the long-term bond proxy, up to 88.90 yesterday, or +1.3%.
Another fear day move up, and it’s back on the short side again from this
corner.
Volume picked up late in
the day as total NYSE volume ended at 1.38 billion, a volume ratio of 21, and
breadth -599. All major sectors were red, led by the
(
SMH |
Quote |
Chart |
News |
PowerRating)s, -5.3%, with
(
INTC |
Quote |
Chart |
News |
PowerRating) -5.5%,
(
KLAC |
Quote |
Chart |
News |
PowerRating) -4.7% and
(
NVLS |
Quote |
Chart |
News |
PowerRating) -5.9%. There was a negative
chip report, so here we go again, folks. And that just means to me that we’re
going to play the next move up. Bad is good with the semis because the upside
reflexes are great after the puke shots.
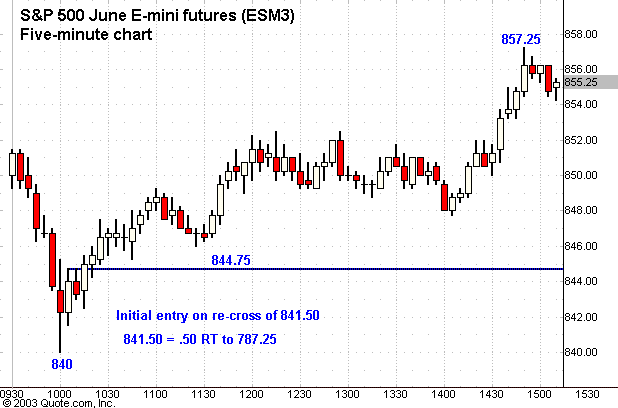
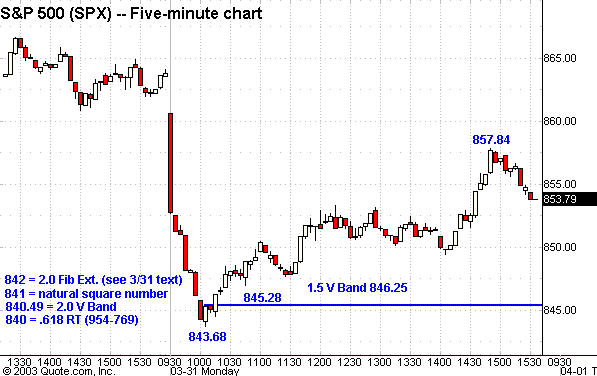
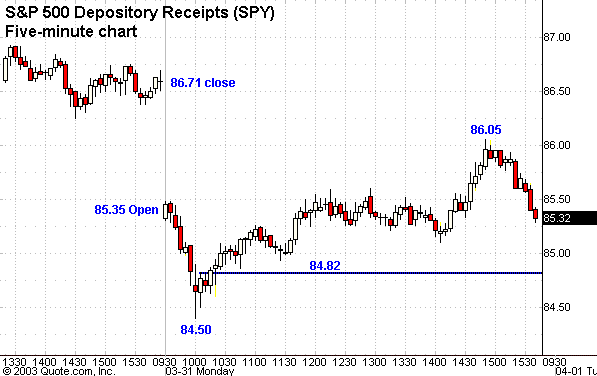
It was an excellent
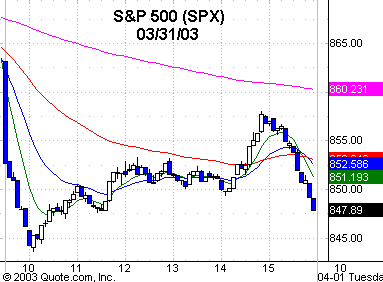
trading day, starting with the Trap Door signal bar, which was the 10:05 a.m. ET
bar. Entry was above 845.28 on the SPX
(
$SPX.X |
Quote |
Chart |
News |
PowerRating). This trade carried up to
858, which is the head-and-shoulder neckline on the chart I presented in the
March 28 commentary. The inside bar pattern at 858 reversed down into the
close to 848.18, -1.8% on the day. The Dow
(
$INDU |
Quote |
Chart |
News |
PowerRating) was -1.9%, and the
Nasdaq
(
$COMPQ |
Quote |
Chart |
News |
PowerRating) -2.1%.
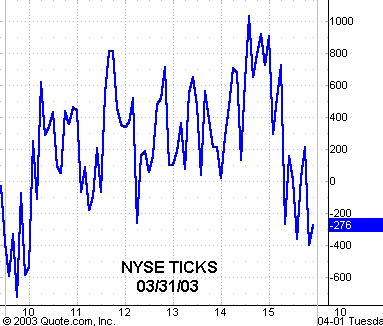
I have included the
five-minute charts of the SPX, S&P E-mini and SPY, which shows you the same
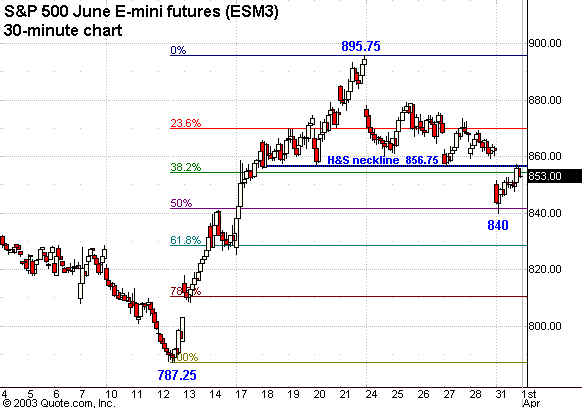
trade details on each. I also included the 20-day 30-minute chart for the S&P
500 E-mini showing the framework for the recent rally from 787.25 to 895.75.
There is also a good confluence of numbers for the SPX with various different
key levels. Also, yesterday was the .50 retracement zone to the SPX 789 low. See
the chart from the March 28 commentary. The number is 842.50, and I forgot to
label it on the SPX chart. Of course, the E-mini and SPY were also .50
retracements.
I showed the SPX, SPY and
E-mini charts because I thought it would be helpful to relate the derivatives
with the SPX cash index, as all three had slightly different Trap Door reversal
entries, but the same result. It helps to keep all three charts up on your
screen while you’re trading.
The rally for the SPX and
its derivatives was repelled at the head-and-shoulder neckline on the 20-day
30-minute chart, which is 858 for the SPX, 856.75 for the E-mini and 86 – 86.35
for the SPYs. This is now the immediate overhead resistance in play. The SPX
closed below its 1.0 volatility band for yesterday, which was 852, so you must
be aware of the next key lower level if the 840 zone gets taken out on the next
spat of bad news. For the SPX, that would be the 830 level, which is the .618
retracement zone to the 789 low, and then 827, which is the .50 retracement to
the 1982 low.
The
(
DIA |
Quote |
Chart |
News |
PowerRating)s closed at
80 with the .618 retracement level at about 78.50, and that level is 25 for the
(
QQQ |
Quote |
Chart |
News |
PowerRating)s, which hit a 25.21 low yesterday, closing at 25.31. The SMHs closed
at 23.09, which is also the intraday low, with the .786 retracement to the 21.83
swing point low at 22.83. This is in the same zone as the .618 retracement
between 31 to 17.32, which happens to be 22.54. The bottom of the trading range
since December is 20.36 vs. 20.25, which is the .786 retracement between 31 and
17.32. After the 20% rally from 21.83 to 26.50, the semis will very soon get
interesting again, and the setup will come on the weakness.
New month, new quarter,
so be ready to pull the trigger on any long intraday setups from this zone if
the dynamics get green today, as maybe some new money gets put to work for the
first few days of this quarter, provided the Iraq news takes a break.
Have a good trading day.
Â
Five-minute chart of
Monday’s SPX with 8-, 20-,
60- and 260-period
EMAs
Five-minute chart of
Monday’s NYSE TICKS
