How to Stay Ahead of a Bear Market
I was watching financial news on TV the other day, and the general theme from the money managers being interviewed was to invest in stocks for the long term. One person even dared to suggest that had you invested in the stock market in August of 1929, while you may have had to wait 16 years, you ultimately would have been ahead of the game. This person may have forgotten about an event called World War II, and there’s a chance that some of the people who invested in 1929 might not have been around to see the market recover.
That may seem like an extreme example, but it does raise an interesting issue. If Wall Street wants us to be invested all the time, what happens if our time frame is not in sync with the market? What if you had invested in the Dow on October 11, 2007? As of Monday, the close of the second quarter, you were down 20%. This is just not acceptable. Not only is it not acceptable, it’s also unnecessary. This article will show you not only how to recognize a change in trend but also how to take advantage of it.
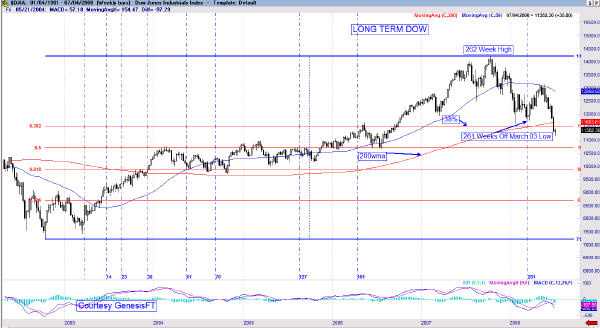
My prior articles on How to Time Market Reversals with Fibonacci Numbers and Identifying Reversals and Breakouts with Time Windows show how to recognize patterns based on Fibonacci and Lucas time windows. The October high in the Dow and SPX were in the 262 week window from the old bear market low in October 2002. It is important not to front run the bars and wait for confirmation of the time window. In this case, the markets validated the time window with a very well defined evening star or a bearish engulfing candle on the weekly time frame. When the candle formations and time windows line up, take what the market is trying to tell you very seriously. That is the first clue not to treat business as usual. To understand what is happening today, it is vital to understand what led up to today. Large degree turn windows which are validated normally lead to large moves in the opposite direction.
The next condition to understand is where important support and resistance areas are. These lines act as magnets and attract price action to them. They usually come in the form of Fibonacci retracement lines as well as moving averages. As Chart 1 of the Dow demonstrates, the January low came down to a 38% retracement of the whole move up.

While the Dow almost touched the 200-week moving average (200-week MA) and the SPX overshot it slightly, the NDX 100 came right down to it and turned up. The 200-week MA is an excellent indicator for determining whether the market is experiencing an intermediate term correction or a long term bear market. If the chart dips below but makes a quick recovery within a couple of weeks, markets have a chance to recover. When they go down and can’t recover quickly, the probability shifts to a long term bear. For extra confirmation we look to the time cycles. The March low not only retested the 200-week MA, the 38% retracement, but it also validated a 262 week low to low cycle with the important March 2003 pivot where the decade long rally began in earnest. Last week the
The Dow violated all three!
Now that overall market conditions have been examined, the trader can begin to orient his thinking to shorting opportunities as opposed to going long. Being short is similar to being long with one notable exception. Bull markets climb a wall of worry and bear markets fall down the slope of hope. The euphoria that ends a bull usually takes much longer to develop than do the fear levels that end a bear. You can see from the Dow chart that 55 trading weeks worth of gains are wiped out in 15 weeks. For this reason, it is likely that many mistake the speed of the price action caused by fear to be a long term bear market bottom. We could have had a bottom at the March lows, but now markets have broken longer term support lines and this must be taken just as seriously as that 262 week top back in October.
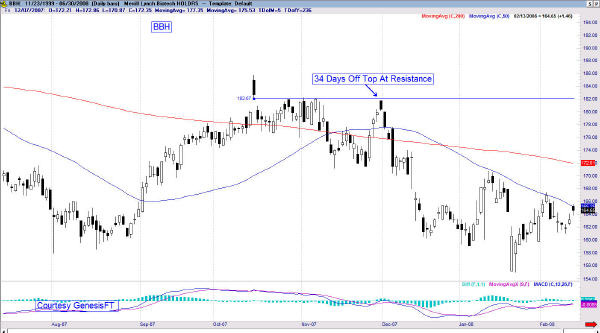
Since markets move so quickly, one does not want to pile in with the crowd and chase a down trend. This can be almost as hazardous to the trading account as going long near a market top. The idea is to catch the price action at a good price/time cluster near resistance. This resistance can take the form of a moving average, Fibonacci line, or a gap down that is set by market action. In the Chart 2, the BBH made a high a couple of days after the Dow on October 15.

In a vacuum, this would not be considered to be a sell signal. However the action which followed suggested a ridge of resistance was forming as buyers could not push prices beyond the top of the gap created on October 16. Price action fell off but recovered, and the retest of the high failed right at the same ridge near the gap. Once resistance is established, it is important to see it is confirmed. For confirmation, look for a good time window that is confirmed by a candlestick reversal formation. A very well defined evening star pattern materialized on the 34 (Fibonacci) bar high to high window. It is this failure at resistance that clusters with the time element, acting as the sell signal. A good entry materializes once prices get below the small real body candle on the way up near 179.
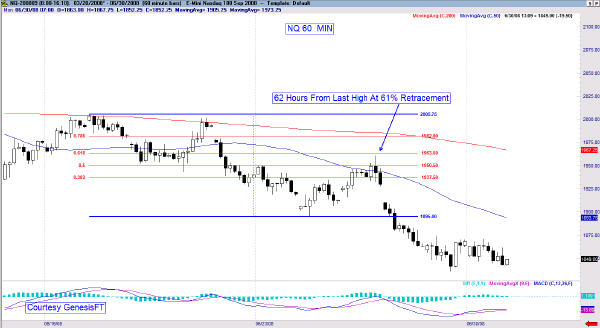
The next example on Chart 3 is for those who may have a shorter time frame. It is an example on an hourly chart of the day session for the NASDAQ E-mini.

The concept is exactly the same. Look for a failure at a form of resistance on a good time window. In this case, an upper tail is formed on the 61st hour off a larger pivot near a 61% retracement line. Price action is also near the 50 hour moving average. Once again, an evening star pattern forms which implies the combination of price and time are validating, thus producing a sell signal.
This is a cookie cutter approach. During a bear market, these patterns will repeat over and over. Patterns act like snowflakes. While no two patterns are exactly the same, they are similar and not too difficult to recognize once you know what to look for. The catch in a bear market is to be patient. One must not get carried away by emotion and chase losers. The idea is to use strict discipline to catch patterns at a good price, and time clusters at resistance.
Finally, the question is when do you cover? There isn’t an easy answer, but just like at the high, markets do exhibit a high degree of precision when price and time to line up to form a low. When sentiment indicators show enough fear at these price/time clusters, odds are the markets will once again go the other way.
Jeff Greenblatt has written numerous articles and speaks at trading conventions. He is a regular guest on 1510 KFNN in Phoenix, AZ where he lives. For more information visit www.lucaswaveinternational.com or email Fibonacciman@aol.com.
